Figures & data
Figure 1. LPS on the cell wall of gram-negative bacteria. Graphic representation of a Gram-negative bacterium cellular membrane together with a scheme of the LPS structure. LPS: lipopolysaccharide; Gln: glucosamine; P: phosphate group.
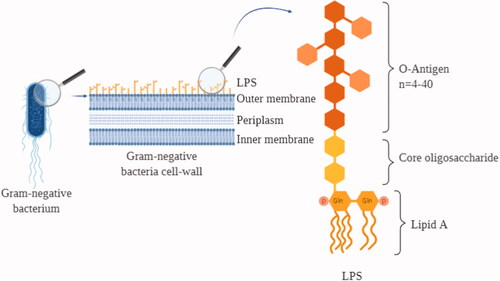
Table 1. LPS detection methods useful for NP testing.
Figure 2. Summary of non-conventional techniques for detection and quantitative analysis of LPS on NPs. (A) Dynamic light scattering data showing hydrodynamic diameter (d) and ζ-potential (Z) distributions of 50 nm AuNPs before and after incubation with LPS. The mean values acquired before and after the LPS incubation are reported on the graph. The presence of LPS can be detected by measuring a shift into the NP size and ζ-potential distributions. (B) TEM images showing 50 nm AuNPs before and after incubation with LPS. From the TEM image acquired after the LPS incubation, it is possible to observe the LPS corona of about 4–5 nm (grey halo) around the NPs (black sphere). (C) SERS spectrum of 50 nm AuNPs, either bare or incubated with LPS, acquired with a Raman microscope equipped with a 785 nm wavelength laser (Manago et al. Citation2018). The spectral bands allow the biochemical identification of the LPS components, while the signal intensity can be used for LPS quantitation. (D) UV-Vis spectrum showing a decrease of the SPR peak at 525 nm and an increase of the peak at 650 nm related to the agglomeration state of CSH-AuNPs upon addition of increasing LPS concentrations. Inner: Visual colorimetric change of the CSH–AuNPs upon addition of LPS (Sun et al. Citation2012). The measurement of (A650/A525)1/2 values in the presence of different LPS concentrations allows quantitative analysis. Reprinted with permission. (E) Electrochemical impedance assay showing the changes of the electrode/electrolyte interface (AuNPs) by applying an oscillating potential as a function of frequency (Nyquist plot). When the concentration of endotoxin is high, the semi-circles of Nyquist plots increase, due to the rearrangement of LPS molecules on AuNPs and the inherent variation of their electric properties. Inner: schematic representation of the assembly of the LPS-detecting aptasensor (Su et al. Citation2013). Reprinted with permission. (F) Fluorescence intensity increase as a function of the LPS concentrations for the fluorescence-based sensor proposed by Gao et al. (Citation2017). Reprinted with permission.
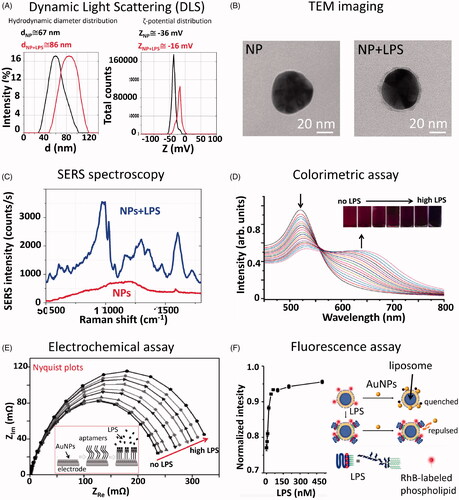
Figure 3. Intensity comparison between LPS Raman spectrum and LPS-NPs SERS spectrum. (A) SERS signal (NPs + LPS, upper line) measured using sample concentration conditions of 5 µg LPS on 2 µg (1.4 × 10⁹ particles) of 50 nm AuNPs. Conditions of acquisition: λex = 785 nm; integration time = 1 s; laser power = 0.1 mW (Manago et al. Citation2018; Quero et al. Citation2018). Reference Raman spectrum of the LPS powder (LPS only, lower line). Condition of acquisition: λex = 785 nm; integration time = 60 s; laser power = 10 mW. The spectra are an average over 30 acquisitions. (B) Assignment of the observed SERS and Raman bands based on the literature (Barrett Citation1981; Osorio-Roman et al. Citation2010; Czamara et al. Citation2015). LPS component band assignment related to Lipid A and O-antigen/Core are indicated on spectra peaks. δ: deformation vibrations; ν: stretching vibrations.
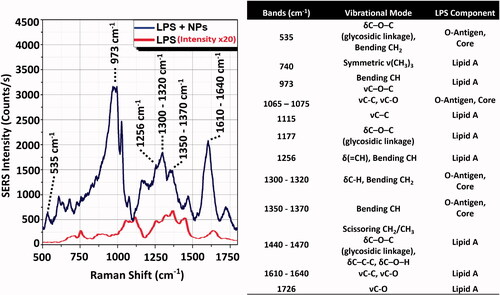
Table 2. NP-based LPS detection assays
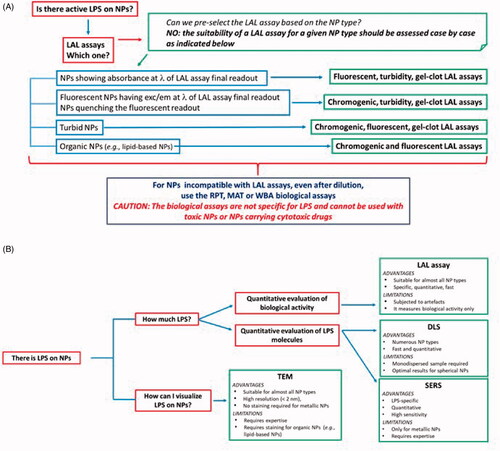
Figure 4. Decision tree. (A) In order to detect LPS contamination in NP samples, the first choice is generally the LAL assay. The LAL assay format is chosen depending on NP characteristics and behaviour in the assay conditions. Here we reported a synthetic guide on how to choose the most suitable LAL assay. Note that in general the suitability of a specific LAL assay for NP samples should be verified empirically case by case. If NPs interfere with LAL assay components or final readout, diluting NPs until the interference disappear can be an efficient solution. When NPs are not suitable for any LAL assay format, other functional assays (RPT, MAT or WBA) are used, which however are not specific for LPS and cannot be used with cytotoxic NPs. (B) If NPs are contaminated by LPS, the contamination can be quantified by LAL (if you are interested to determine the LPS biological activity) or by DLS or SERS, to determine the number of LPS molecules, the choice of technique depending on the NP physico-chemical characteristcs. The presence of the LPS on NPs can be visualized by TEM. Note that in this figure the NP-based LPS detection assays have not been included since they are intended for different types of samples and cannot be applied to NP-containing samples. Information on such assays is reported in the paragraph ‘NPs for Detection and Quantitation of LPS’ and in the . LAL: Limulus amoebocyte lysate; exc/em: excitation/emission; RPT: rabbit pyrogen test; MAT: monocyte activation test; WBA: whole blood assay; TEM: transmission electron microscopy: DLS: dynamic light scattering; SERS: surface-enhanced Raman spectroscopy.