Figures & data
Table 1. SP-ICP-MS measurement of receptor fluid exposed to donor fluid 1.
Figure 1. Scheme of experimental set-up used for testing Ag concentration in different compartments of Franz Cell System.
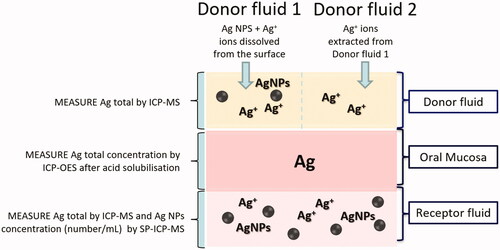
Figure 2. TEM images and DLS size (diameter) distribution of the Ag NPs dispersed in physiological solution.
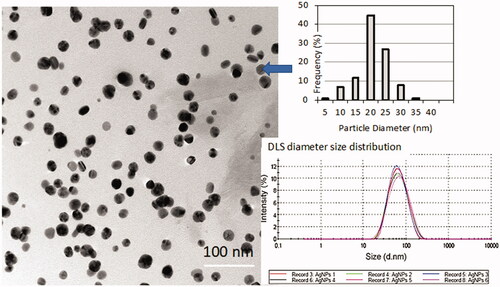
Figure 3. Total Ag detected in oral mucosa from the two donor fluids after 240 min exposure. The donor fluid 2 contains the Ag+ ions extracted by donor fluid 1, so the differences are due to the penetration of Ag NPs of Donor fluid 1. *: values significantly different from the blank, p < 0.05.
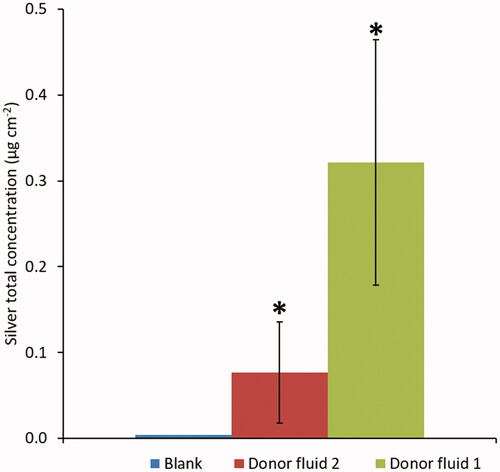
Figure 4. Silver permeation in the receptor fluid. The value of silver total concentration after 240 min of exposure correspond to a silver content of 65.7 ± 16.4 µg L−1 in receptor fluid (*: values are significant different from the blank, p < 0.05).
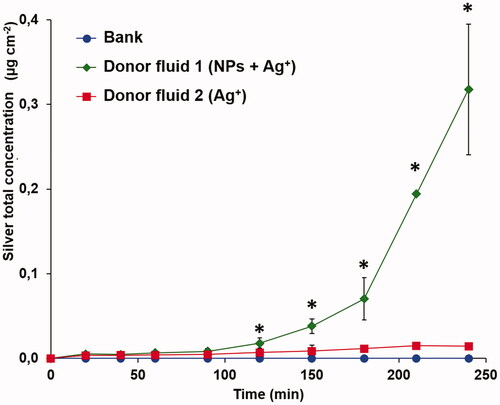
Figure 5. Ag NPs size distribution by frequency detected by SP-ICP-MS, at different time of exposure.
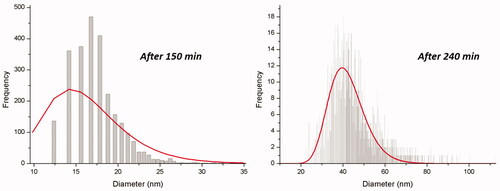
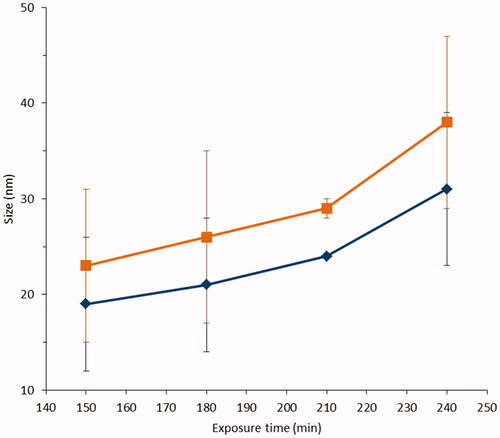
Figure 6. Size distribution of Ag NPs permeated in the receptor fluid as a function of time: ▪ most frequent size (size at the maximum of the size distribution histogram) and ♦ mean size (Z-average). There are no statistically relevant differences between the two size populations (blue and orange) (p < 0.05 only for sample at 210 min) and comparing different times (ca. p = 0.17).