Figures & data
Table 1. Specific physio-chemical characteristics determined for both Au and Ag ENPs and mass spectrometry protein analysis.
Figure 1. Telomeric Q-FISH specific in situ hybridization protocol as described in a schematic diagram.
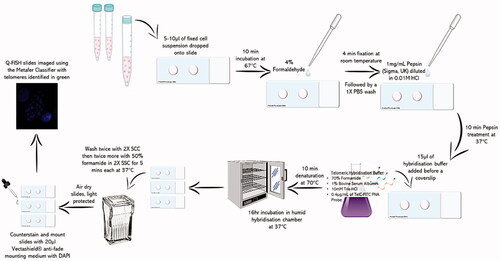
Figure 2. Cell viability of both A549 and 16HBE14o− lung epithelial cells following 24-h exposure to (A) Au ENPs and (B) Ag ENPs. Percentage difference in (A) cell death (as determined by the Trypan Blue Exclusion Assay) and (B) LDH release observed relative to the 0.1% Triton-X positive control between pre- and post-ENP exposure. Data presented as the mean ± SEM of three biological replicates. Significance is indicated as follows: ***p ≤ 0.001 and ****p ≤ 0.0001.
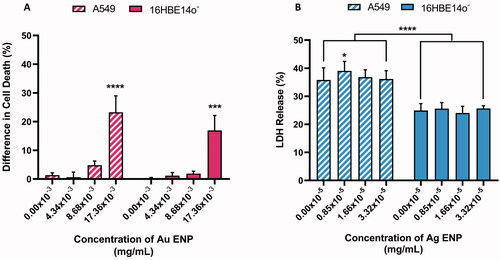
Figure 3. cLSM image showing (A) 16HBE14o− negative control, (B) Ag ENP interaction with 16HBE14o− cells at the lowest concentration of 0.83 × 10⁻⁵ mg/mL, whilst (C) illustrates the extent of this Ag ENP-cell interaction in Imaris rendered images of the 16HBE14o− cells exposed to 1.66 × 10⁻⁵ mg/mL of Ag ENPs. DAPI (blue) highlights the cell nucleus, whilst the Phalloidn 633 (red) stain outlines the cytoskeleton and TAMRA (yellow) indicates the presence of Ag ENPs. Magnification 63×. Scale bar for all images, with the exception of (B), is 20 µm whilst (B) is 10 µm.
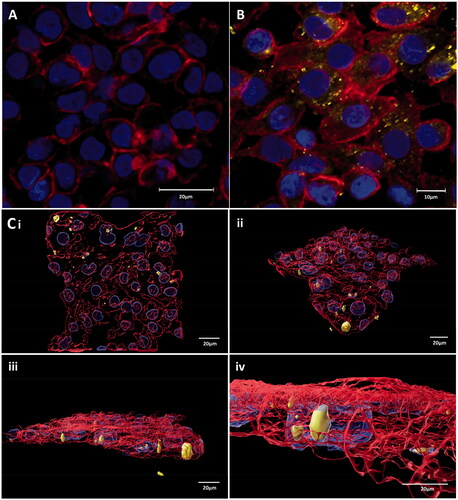
Figure 4. Representative PE-Cy7-A (A–C) and FITC-A (D–F) fluorescence histograms and average median fluorescence indicating ENP-cell interaction following 24-h exposure to Au and Ag ENPs, respectively. Fluorescence histograms (A) and (B) represent Au ENP interaction with A549 and 16HBE14o− epithelial cells respectively, whilst (D) and (E) represent Ag ENP interaction with A549 and 16HBE14o− epithelial cells. Exact median fluorescence values are listed in the table below each histogram. The average median fluorescence following exposure to increasing concentrations of Au (C) and Ag ENPs (F) on A549 and 16HBE14o− epithelial cells. Data presented as the mean ± SEM of three biological replicates. Significance in relation to the negative control is indicated as follows: *p ≤ 0.05, **p ≤ 0.01, ***p ≤ 0.001, and ****p ≤ 0.0001. Significance between the two cell types is indicated as follows: xxp ≤ 0.01, xxxp ≤ 0.001, and xxxxp ≤ 0.0001.
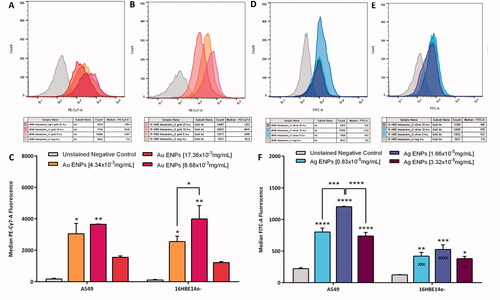
Figure 5. LSM fluorescence images displaying both A549 and 16HBE14o− lung epithelial cell morphology with and without 24-h exposure to Au and Ag ENPs. DAPI (blue) highlights the nucleus whilst the Phalloidn 633 (red) stain outlines the cytoskeleton. (A) and (B) displays the natural cell morphology of untreated A549 and 16HBE14o− cells, respectively. A549 cell morphology following 24-h exposure to 4.34 × 10⁻³ mg/mL (C), 8.68 × 10⁻³ mg/mL (D) and 17.36 × 10⁻³ mg/mL (E) of Au ENPs and 0.83 × 10⁻³ mg/mL (F), 1.66 × 10⁻³ mg/mL (G) and 3.32 × 10⁻⁵ mg/mL (H) of Ag ENPs. 16HBE14o− cell morphology following 24-h exposure to 4.34 × 10⁻³ mg/mL (I), 8.68 × 10⁻³ mg/mL (J) and 17.36 × 10⁻³ mg/mL (K) of Au ENPs and 0.83 × 10⁻³ mg/mL (L), 1.66 × 10⁻³ mg/mL (M) and 3.32 × 10⁻⁵ mg/mL (N) of Ag ENPs. Magnification 63×. Scale bar represents 20 µm.
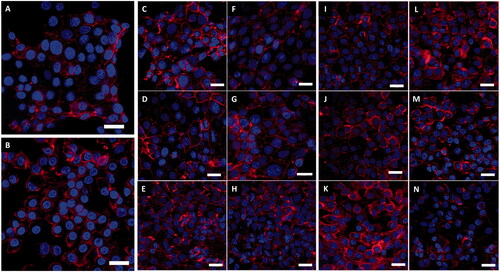
Figure 6. Quantity of the antioxidant reduced GSH (glutathione) present following 24-h exposure to increasing concentrations of (A) Au ENPs and (B) Ag ENPs upon both A549 and 16HBE14o− cell lines. Data presented as the mean ± SEM of two biological replicates, analyzed in triplicate. Significance in relation to the negative control is indicated as follows: *p ≤ 0.05, **p ≤ 0.01, ***p ≤ 0.001, and ****p ≤ 0.0001.
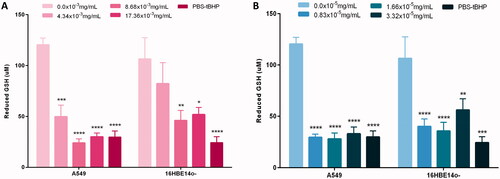
Figure 7. Cytokinesis-block micronucleus data displaying the cytotoxic, genotoxic and proliferative effect of 24-h exposure to Au and Ag ENPs. Light microscopy images (100×) of untreated, giemsa stained A549 cells highlighting (A) both mononucleated and BN epithelial cells and (B) a BN cell with a MN present. Cytotoxicity (cell viability) and genotoxicity (the percentage MN frequency per 1000 BN cells) of A549 and 16HBE14o− cells post 24-h Au and Ag exposure are displayed in (C). Data presented as the mean ± SEM of three biological replicates, where for each exposure, 1000 binucleated cells were scored per replicate for each dose point using the cytokinesis-block version of the MN assay (3000 binucleate cells scored in total per dose). Significance in relation to the negative control is indicated as follows: *p ≤ 0.05, **p ≤ 0.01, ***p ≤ 0.001, and ****p ≤ 0.0001.
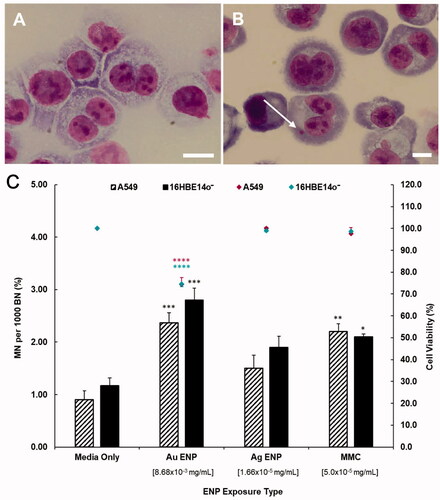
Figure 8. Clastogenic and aneugenic micronucleus staining in A549 and 16HBE14o− epithelial cells following 24-h exposure to the mid-range concentrations of Au and Ag ENPs. Post 24-h exposure to 8.68 × 10⁻³ mg/mL Au ENPs, (A) highlights a binucleated A549 cell displaying a micronucleus of aneugenic origin, loss of a whole chromosome, indicated by the green FITC fluorescence signal in the micronucleus identified by the white arrow. DAPI (blue) stain indicating cellular nuclei whilst FITC (green) fluorescence signifies the centromere. (B) displays the ratio of clastogenic and aneugenic events in micronuclei formation following 24-h exposure to the mid-range concentrations of Au and Ag ENPs. Data is presented as the mean ± SEM of three biological replicates. Significance in relation to the negative control is indicated as follows: *p ≤ 0.05, **p ≤ 0.01, and ****p ≤ 0.0001.
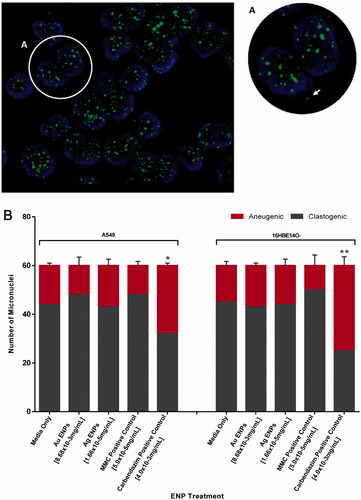
Figure 9. Average telomere length of A549 and 16HBE14o− cell lines, indicated by the average median FITC-A fluorescence following 24-h exposure to the mid-range concentrations of Au and Ag ENPs. Data is presented as the mean ± SEM of three biological replicates.
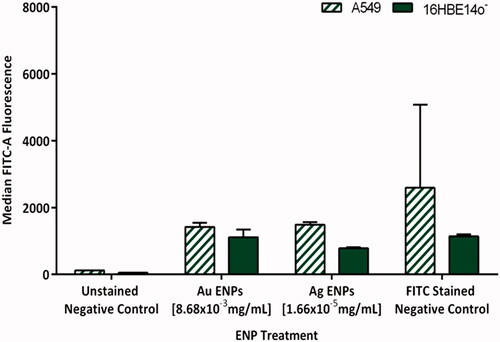
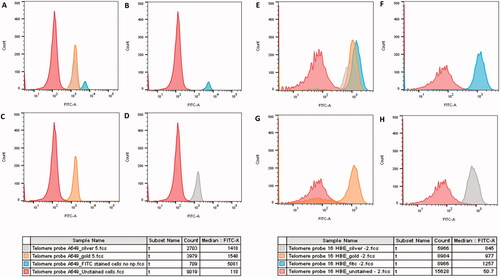
Figure 10. Flow cytometry histograms depicting the Tel-C FITC-A fluorescence emitted following 24-h exposure to 8.68 × 10⁻³ mg/mL Au and 1.66 × 10⁻⁵mg/mL Ag ENPs on A549 (A–D) and 16HBE14o− (E–H) cells. (A) and (E) display an overlay of all two ENP exposures and controls, whilst (B) and (F) shows the negative, unstained control and the positive Tel-C FITC only stained positive control. Shifts in FITC-A fluorescence indicating Tel-C FITC probe and telomere hybridization following Au (C, G), and Ag (D, H) ENP exposure. Color key below displays the average median FITC-A fluorescence. Data is presented as the mean ± SEM of three biological replicates.