
Figures & data
Figure 1. Cytotoxicity of the seven aSiO2 variants under study in rat alveolar epithelial RLE-6TN cells after 24 h of exposure, measured by lactate dehydrogenase (LDH) release (A) and WST-1 reduction (B). Data are expressed as mean ± standard deviation of three independent experiments, each performed in triplicate. LDH release values were normalized considering the positive control (PC; cells lysed with 0.2% Triton X-100), while WST-1 reduction values were normalized considering the negative control (NC; serum-free cell culture medium). Vehicle (Veh; serum-free cell culture media containing 100 μg/mL of Pluronic® F-108 as dispersant). Data were analyzed by one-way ANOVA followed by Dunnett’s post hoc test for multiple comparisons. *p < 0.05 vs. NC.
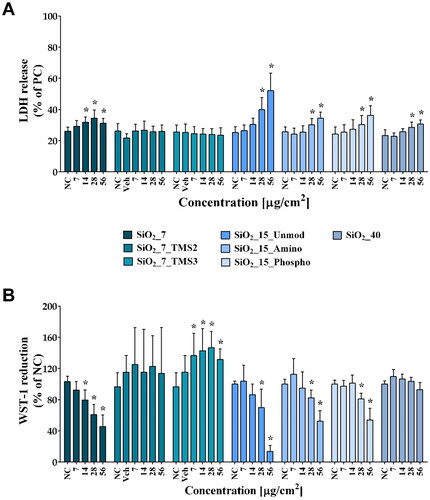
Table 1. Half-maximal (IC50) and 25% (IC25) inhibitory concentrations for the tested aSiO2 variants calculated based on data from WST-1 reduction assay concentration-response curves of WST-1 reduction in RLE-6TN after 24 h of exposure.
Figure 2. DNA damage (% DNA in tail) of RLE-6TN cells exposed to the aSiO2 NM variants for 24 h, as assessed using the alkaline comet assay. Negative control (NC; serum-free cell culture medium); Vehicle: (Veh; serum-free cell culture media containing 100 μg/mL of Pluronic® F-108 as dispersant; positive control (PC; cells exposed to 250 μM of methyl methane sulfonate [MMS]). Data are expressed as mean ± standard deviation of three independent experiments, each performed in duplicate. Data were analyzed by Kruskal–Wallis test followed by Dunn’s multiple comparisons. *p < 0.05 vs. NC.
![Figure 2. DNA damage (% DNA in tail) of RLE-6TN cells exposed to the aSiO2 NM variants for 24 h, as assessed using the alkaline comet assay. Negative control (NC; serum-free cell culture medium); Vehicle: (Veh; serum-free cell culture media containing 100 μg/mL of Pluronic® F-108 as dispersant; positive control (PC; cells exposed to 250 μM of methyl methane sulfonate [MMS]). Data are expressed as mean ± standard deviation of three independent experiments, each performed in duplicate. Data were analyzed by Kruskal–Wallis test followed by Dunn’s multiple comparisons. *p < 0.05 vs. NC.](/cms/asset/290b2e29-58d1-45ed-9f98-222c7248ff9a/inan_a_2265481_f0002_c.jpg)
Table 2. Hazard ranking of the aSiO2 NM variants based on in vitro cyto- and genotoxicity (DNA damage) data sets of rat alveolar epithelial RLE-6TN cells.
Figure 3. Cell cycle distribution of RLE-6TN cells. Percentage of cells in different phases after exposure for 24 h to the four aSiO2 NM variants tested (SiO2_7, SiO2_15_Unmod; SiO2_15_Amino, and SiO2_40). Values are expressed as mean ± standard deviation of three independent experiments, each performed in triplicate. Data were analyzed by one-way ANOVA followed by Dunnett’s post hoc test. *p < 0.05 vs. negative control (NC).
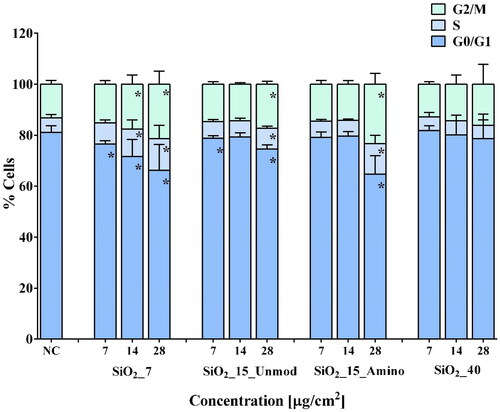
Figure 4. Flow cytometry analysis of histone H2AX phosphorylation in RLE-6TN cells. Percentage of phosphorylated histone H2AX (% γ-H2AX), total and in each cell cycle phase, after exposure to the aSiO2 NM variants (SiO2_7, SiO2_15_Unmod; SiO2_15_Amino and SiO2_40). Data are expressed as mean ± standard deviation of three independent experiments, each performed in duplicate. Data were analyzed by one-way ANOVA followed by Dunnett’s post hoc test. Total γ-H2AX: *p < 0.05 vs. NC; γ-H2AX in each phase of cell cycle: #p < 0.05 vs. NC.
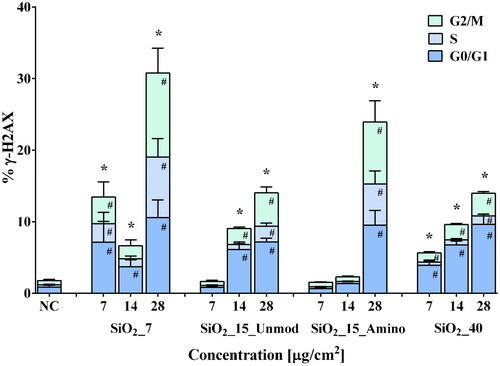
Table 3. Hazard ranking of the tested aSiO2 NM based on the genotoxicity endpoints data sets of rat alveolar epithelial RLE-6TN cells.
Supplemental Material
Download Zip (1.7 MB)Data availability statement
The data sets used and/or analyzed during the current study are available from the corresponding authors on reasonable request.