
Figures & data
Table 1. Composition of each formulation tested.
Figure 1. SLN-mediated transfection in prostate cells. PNT1A and PC-3 cells were plated in a 12-well plate. After 24 h, cells were incubated with SLNplex (SLN:pEGFP-N1) for 4 h, and the transfection medium was replaced with a complete RPMI medium. After 24 h of transfection, cells were trypsinized and transfection efficiency was determined by flow cytometry using FACS calibur. (A) Transfection efficiency in PNT1A and PC-3 cells; (B) Fluorescence intensity in PNT1A and PC-3 cells. The Lipofectamine 2000 group was used as a positive control for transfection. (C) PNT1A cells transfected with SLN:pEGFP-N1 and cell morphology (phase contrast); (D) PC-3 cells transfected with SLN:pEGFP-N1 and cell morphology (phase contrast). Each value represents the average of three independent experiments (n = 2). (a and e) SLN vs. Lipofectamine 2000 (PNT1A); (b and f) DOTAP vs. Lipofectamine 2000 (PNT1A), (c and g) SLN vs. Lipofectamine 2000 (PC-3); (d and h) DOTAP vs. Lipofectamine 2000 (PC-3), p significant difference by Two-way ANOVA, followed by sidak’s mutual comparison test. Scale bar 50
m.
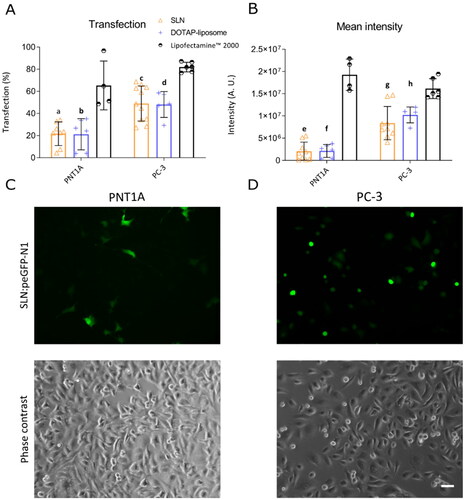
Figure 2. Cell migration velocity of prostate cells in the presence of SLN. PNT1A and PC-3 cells were plated at a density of cells/well. On the following day, cells were serum-starved for 24 h before being incubated for 4 h with SLN or TGF-
(10 ng/mL). Then, the scratch was made and images were acquired every 15 minutes on Cytation 5 Hybrid Multidetection Reader (BioTek Instruments, Inc., Winooski, VT, USA). Cell migration velocity is in
/min. Each value represents the mean
standard deviation (SD). The points represents all the replicates of three independent experiments (n = 2). (i) SLN vs. Control (PC-3), p
significant difference by Two-way ANOVA, followed by Sidak’s mutual comparison test.
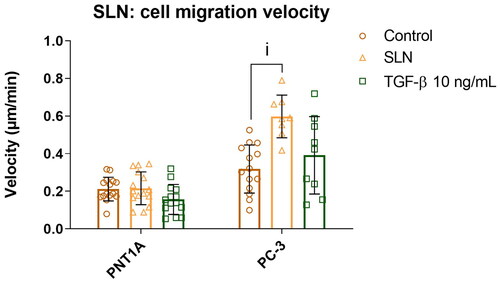
Figure 3. Cell migration velocity of prostate cells in the presence of SLN and its components. PC-3 cells were plated at a density of cells/well. After 24 h, the cells were serum starved for 24 h. Afterward, the cells were treated with SLN, TGF-
and the individual components stearic acid, DOTAP, and pluronic F68 for 4 h. Then, the scratch was made and images were acquired every 15 min in Cytation 5 Cell Imaging Multi-Mode Reader (BioTek Instruments, Inc., Winooski, VT, USA) for 48 h. Cell migration velocity in
/min for PNT1A and PC-3 cells. Each value represents the mean
the standard deviation of three independent experiments (n = 2). (i) SLN vs. Control (PC-3), p
significant difference by Two-way ANOVA, followed by Tukey’s multiple comparisons tests.
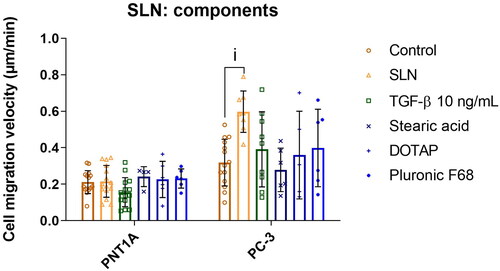
Figure 4. SLN induces the migration of PC-3 cells in a dose-dependent manner. PC-3 cells were plated at a density of cells/well. After 24 h, the cells were serum starved for 24 h. The cells were then treated for 4 h with SLN in the following concentrations: 0
/mL (0×, control), 0.076
/mL (0.02×), 0.38
/mL (0.1×), 0.76
/mL (0.2×), and 3.8
/ml (1×). Then, the scratch was made and images were acquired every 15 min in Cytation 5 Cell Imaging Multi-Mode Reader (BioTek Instruments, Inc., Winooski, VT, USA) for 48 h. Cell migration velocity in
/min. Each value represents the mean
the standard deviation. The points represent all the replications of three independent experiments (n = 2). (i) Control (0x) vs. 0.76
/mL, (ii) Control (0x) vs. 3.8
/ml (1×), p
significant difference by Two-way ANOVA, followed by Tukey’s multiple comparisons test.
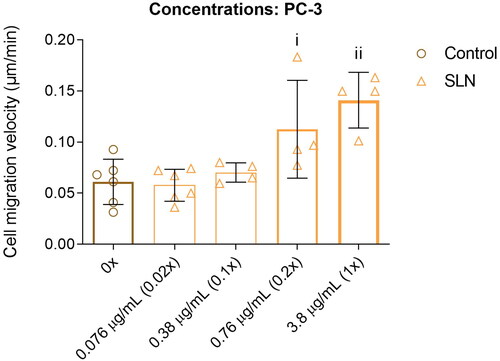
Figure 5. Cell proliferation in the presence of SLN in PC-3 and PNT1A cells. Cells were plated at a density of cells/well onto coverslips. After overnight incubation, the cells were serum starved for 24 h. Next, the cells were incubated with SLN:pET28A for 4 h. After that, the medium was replaced by RPMI without FBS but containing EdU, and after 5, 24, and 48 h, the cells were fixed with 4% PFA and prepared for Click-iT Plus EdU Cell Proliferation Kit for Imaging, Alexa Fluor 647. The images were acquired in a Cytation 5 Cell Imaging Multi-Mode Reader (BioTek Instruments, Inc., Winooski, VT, USA) with a 20× objective. Cell proliferation rate is based on the ratio of cells labeled with EdU (in red) to the total cells (DAPI, in blue) at 5, 24, and 48 h for PNT1A (A) and PC-3 (B) cells; Representative images of the control cells and treated with SLN after 5 h, 24 h, and 48 h of PNT1A cells (C) and PC-3 cells (D). Each value represents the median (central line in the boxplot)
the lower quartile, the upper quartile, and outliers represented by points above or below the boxplot, from two independent experiments (n = 2) p
significant difference by One Way ANOVA. About 7,000 cells were counted in each treatment. Scale bar 100
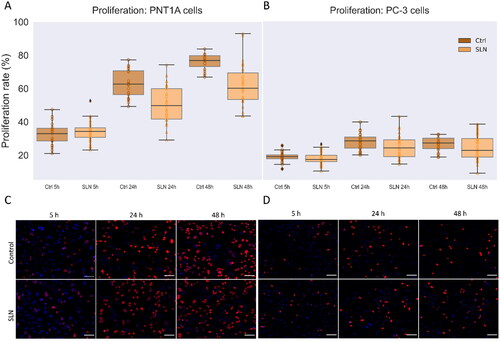
Figure 6. Vimentin expression in PC-3 cells at the migratory front in the presence of SLN after 12 hours of migration. PC-3 cells were deprived of FBS for 24 h, then were treated with SLN:pET28A or TGF- (10 ng/mL) for 4 h. After treatment, the culture medium was replaced with RPMI without SFB and vertically scratched using a p200 pipette tip. The cells were fixed after 12 h of migration and immunostained for vimentin. Images were acquired on Cytation 5 cell Imaging Multi-Mode Reader (BioTek Instruments, Inc., Winooski, VT, USA) using 20× objective. Quantification of the intensity and texture in single-cells was made using CellProfiler. Cells with mesenchymal-like phenotypes are indicated with a yellow arrow. Scale bar represents 50
(A) Cells_texture_InfoMeas1_vimentin_20_03_256 feature,(B) Cells_intensity_IntegratedIntensity_vimentin, and (C) Representative images of PC-3 cells. Cells with mesenchymal-like phenotypes are pointed by yellow arrows. Scale bar 50 µm. All points represent the single-cells of two independent experiments (n = 1). Z-test (comparison of means with all other means) was performed using statannotations and statmodels package: ****for p< =1.00e-04.
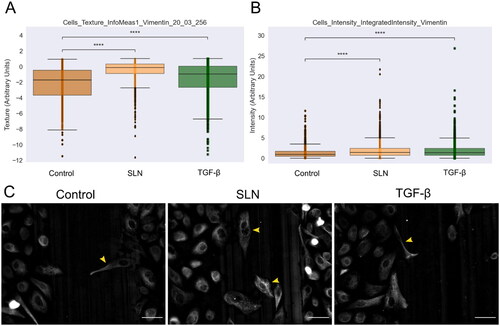
Figure 7. Nuclear translocation of Smad2 in PNT1A cells. PNT1A cells were plated on coverslips previously treated with poly-L-lysine and plated at a density of cells/well. After 24 hours, cells were treated with SLN:pET28A or TGF-
(10 ng/mL) for 45 min, 1 h, 2 h, and 4 h. After the treatment periods, the cells were fixed with 4% PFA and prepared for immunofluorescence of Smad2, and then labeled with Alexa Fluor 488. After immunostaining, the images were acquired using a 10× objective with Cytation 5 Cell Imaging Multi-Mode Reader (BioTek Instruments, Inc., Winooski, VT, USA). (A) Single-cells nuclei integrated intensity of Smad2 after 45 min, 1 h, 2 h, and 4 h; (B) Intensity ratio between the integrated intensity of the nuclei/integrated intensity of the cells; (C) Representative images of Smad2 in grayscale. Each value represents the median (central line in the boxplot)
the lower and upper quartile, and outliers are represented by points from three independent experiments (n = 2). Z-test (comparison of means with all other means) was performed using statannotations and statmodels package: ****For p< = 1.00e-04. Scale bar 50
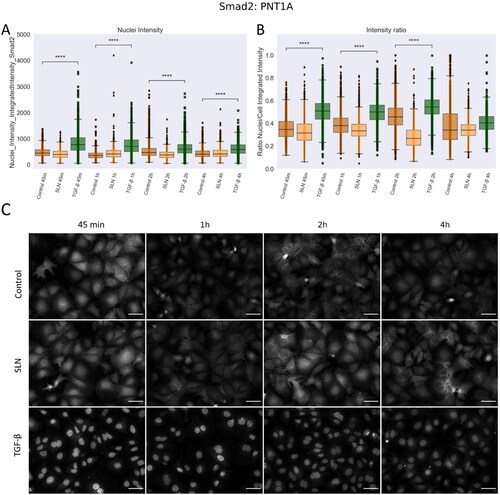
Figure 8. Nuclear translocation of Smad2 in PC3 cells. PC-3 cells were plated on coverslips previously treated with poly-L-lysine and plated at a density of cells/well. After 24 hours, cells were treated with SLN:pET28A or TGF-
10 ng/mL for 45 min, 1 h, 2 h, and 4 h. After the treatment periods, the cells were fixed with 4% PFA and prepared for immunofluorescence of Smad2, and then labeled with Alexa Fluor 488. After immunostaining, the images were acquired using a 10x objective with Cytation 5 Cell Imaging Multi-Mode Reader (BioTek Instruments, Inc., Winooski, VT, USA). (A) Single-cells nuclei integrated intensity of Smad2 after 45 min, 1 h, 2 h, and 4 h; (B) Intensity ratio between the integrated intensity of the nuclei/integrated intensity of the cells; (C) Representative images of Smad2 in grayscale. Each value represents the median (central line in the boxplot)
the lower quartile, the upper quartile, and outliers represented by points from three independent experiments (n = 2), Z-test (comparison of means with all other means) was performed using statannotations and statmodels package: ****For p< =1.00e-04. Scale bar 50
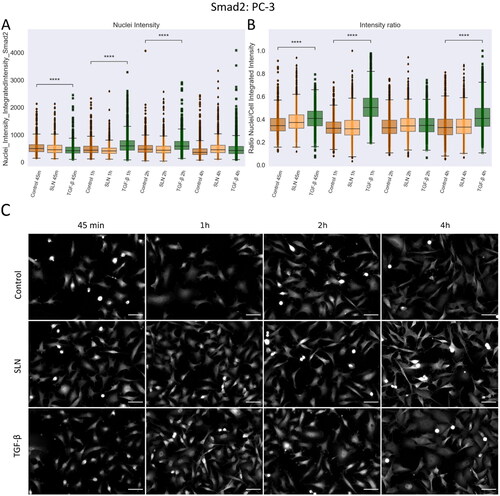
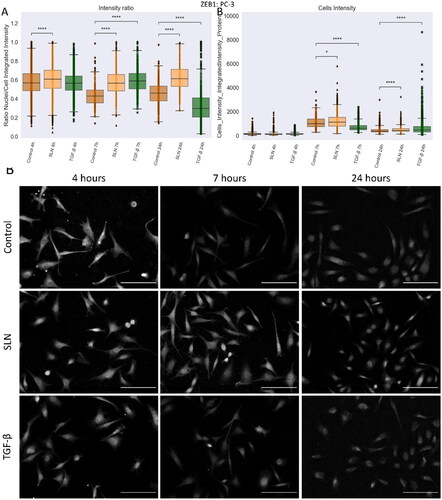
Figure 9. ZEB1 protein in PC3 cells after 24 h of treatment. PC-3 cells were treated with SLN:pET28A and TGF- (10 ng/mL) for 4 h. After 4 h, the culture medium was replaced by RPMI without FBS. The cells were fixed at 4, 7, and 24 h after transfection and prepared for immunofluorescence for ZEB1 and SNAIL. The images were acquired in Cytation 5 cell Imaging Multi-Mode Reader (BioTek Instruments, Inc., Winooski, VT, USA) using a 10× objective. On average,
cells were counted in each treatment. (A) Intensity ratio between the integrated intensity of the nuclei/integrated intensity of the cells for ZEB1; (B) Integrated intensity of ZEB1 within the cells, and (C) Representative images of the PC-3 cells for ZEB1 marker. Each value represents the median (central line in the boxplot)
the lower quartile, the upper quartile, and outliers represented by points from three independent experiments (n = 1) Z-test (comparison of means with all other means) was performed using statannotations and statmodels package: ****For p< =1.00e-04. Scale bar 50
Supplemental Material
Download PDF (3.4 MB)Data availability statement
All data generated or analyzed during this study are included in this published article and its supplementary information files.