Figures & data
Table 1. The characteristics of patients and healthy individuals are shown in Table 1.
Figure 1. Cell survival rates of lymphocytes healthy individuals and HNSCC patients incubated with various treatments of 10 µg/ml pembrolizumab or pembrolizumab liposome and 75 µM H2O2, respectively. Error bars show mean ± SEM, n = 3. All the results for various treated groups were compared against the respective negative control group. NS: nonsignificant. *p < 0.05; **p < 0.01. *** p < 0.001.
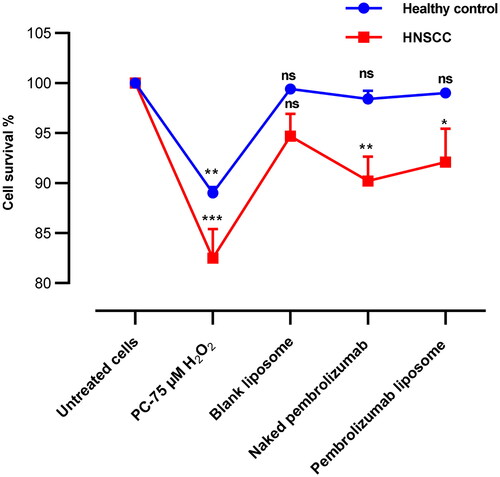
Figure 2. Comparison between the effect of naked and pembrolizumab liposome in lymphocytes from healthy individuals and HNSCC patients using OTM. Cells were treated with different various treatment groups including an untreated lymphocyte group (NC), positive control (pc) 75 µM H2O2, blank liposome, naked pembrolizumab 10 µg/ml, pembrolizumab liposome 10 µg/ml, naked pembrolizumab 10 µg/ml + 75µM H2O2, and pembrolizumab liposome 10 µg/ml +75µM H2O2. All treatment groups were compared against the respective negative control. Each treatment group from both groups was also compared against each other, represented by the horizontal lines on the graph and the statistics on top of these lines. NS: nonsignificant. *p < 0.05; **p < 0.01 ***p < 0.001.
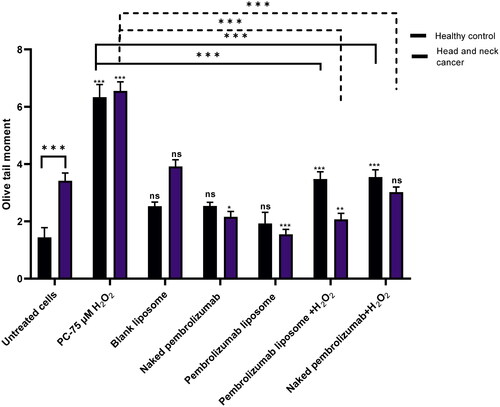
Figure 3. Comparison between the effect of naked and pembrolizumab liposome in lymphocytes from HNSCC patients and healthy individuals using % tail DNA. Cells were treated with different various treatment groups including an untreated lymphocyte group (nc), positive control (PC) 75 µM H2O2, blank liposome, naked pembrolizumab 10 µg/ml, pembrolizumab liposome 10 µg/ml, naked pembrolizumab10µg/ml + 75µM H2O2, and pembrolizumab liposome 10 µg/ml + 75µM H2O2. All treatment groups were compared against the respective negative control. Each treatment group from both groups was also compared against each other, represented by the horizontal lines on the graph and the statistics on top of these lines. NS: nonsignificant. *p < 0.05; **p < 0.01. ***p < 0.001.
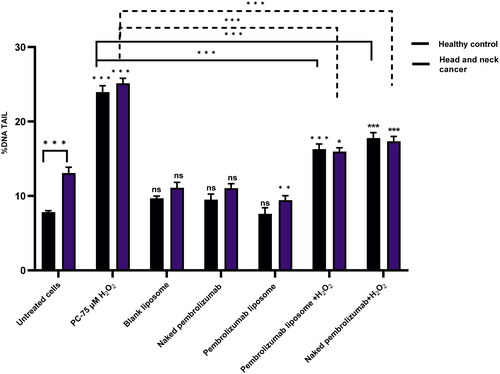
Figure 4. The average of BiNC MNi scored per 1000 cells from 3 individual experiments. Data are expressed as means ± SEM. Eight treatment groups included the negative control, a positive control 1(Mitomycin C, 0.4 µM MMC), positive control 2 (PC, 75 µM H2O2), naked pembrolizumab, naked pembrolizumab 10 µg/ml and 75 µM H2O2, pembrolizumab liposome, pembrolizumab liposome 10 µg/ml and 75 µM H2O2, blank liposome. All treatments were compared to their respective negative control. Each treatment group from both groups were also compared against each other, represented by the horizontal lines on the graph and the statistics on top of these lines. NS: nonsignificant. *p < 0.05; **p < 0.01. ***p < 0.001.
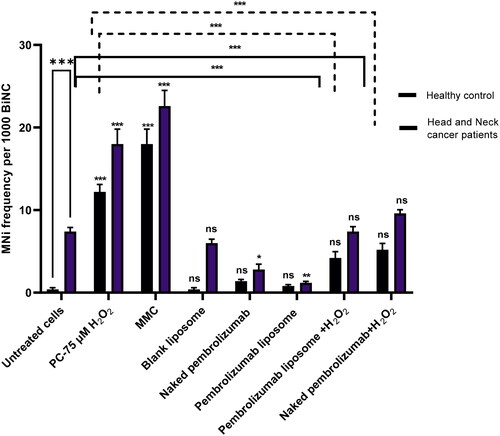
Figure 5. Level of P53, P21 and BCL2 and in lymphocytes from healthy individuals(n = 3). The data were compared against the control group and normalized against the house gene, GAPDH. Three groups included a control group, naked pembrolizumab 10 µg/ml and pembrolizumab liposome 10 µg/ml. There was no significant effect seen on P53 and P21and BCl2 expressions (ns = not significant).
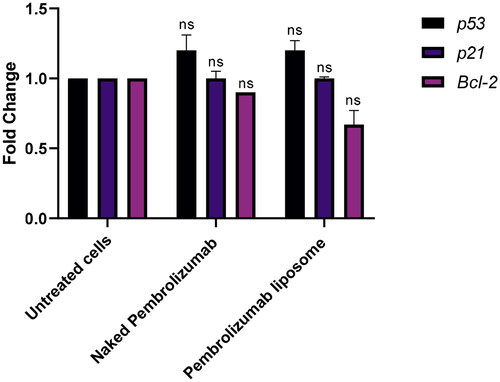
Figure 6. The effect of pembrolizumab naked and liposome forms on the gene expression levels of P53, P21 and BLC2 in lymphocytes from HNSCC patients (n = 3). The data were compared against the control group and normalized against the house gene, GAPDH. Three groups included a control group, naked pembrolizumab 10 µg/ml and pembrolizumab liposome 10 µg/ml. P53 and P21 genes were significantly upregulated; however, the BLC2 gene was significantly downregulated. (ns = not significant, *P < 0.01, **P < 0.001).
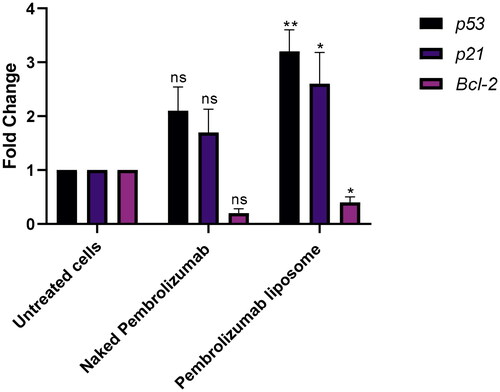
Table 2. Chromosomal instability parameters in the form of the mean of NBUDs, NPBs per 1000 BiNC and MNi frequency in MoNC. The frequency of MNi in BiNC of untreated cells was clearly higher than in lymphocytes treated with pembrolizumab liposome on HNSCC patients.
Figure 7. A, B. The effect of naked and liposome pembrolizumab on the protein expression levels of P53, P21 and BCL2 in lymphocytes from healthy individuals(n = 3). All data from the treatment groups were compared against the control group (C) and normalized against the internal home protein, GAPDH, untreated cells, naked pembrolizumab 10 µg/ml and pembrolizumab liposome 10 µg/ml. Pembrolizumab in both forms did not show any significant effect on P53, and BCL2 protein expression (ns = not significant), (A) Immunoblot analysis of the P53, P21 and BCL2 proteins in lymphocyte from healthy individuals treated with naked pembrolizumab 10 µg /ml and pembrolizumab liposome 10 µg/ml. (B) Bar graphs exhibiting fold changes in protein expression levels. Data are represented as the mean ± SEM of three experiments.
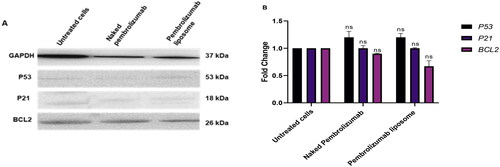
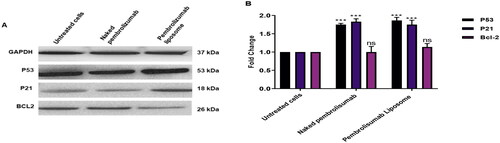
Figure 8. A, B. The effect of naked pembrolizumab 10 µg/ml and pembrolizumab liposome 10 µg/ml on the protein expression levels of P53, P21 and BCL2 in lymphocytes from HNSCC patients(n = 3). All data from the treatment groups were compared against the control group (C) and normalized against the internal home protein, GAPDH, untreated cells, naked pembrolizumab 10 µg/ml, and pembrolizumab liposome 10 µg/ml. Pembrolizumab in both forms significantly upregulated the protein expression levels of P53 and P21; however, the regulation of BCL2 expression was insignificant. (A) Immunoblot analysis of the P53, P21 and BCL2 proteins in lymphocyte from HNSCC patients treated with naked pembrolizumab 10 µg/ml and pembrolizumab liposome 10 µg/ml. (B) Bar graphs exhibiting fold changes in protein expression levels. Data are represented as the mean ± SEM of three experiments. (ns = not significant, ***P < 0.001).