
Figures & data
Table 1. Descriptive statistics for the US and European samples.
Figure 1. Frequency distributions and kernel densities for scaling with total assets.
The distributions are shown for four years spread over the sample period. Left graphs: sample of US firms; right graphs: sample of European firms. Vertical line at zero scaled earnings. Earnings are scaled with total assets at the beginning of the year. A bar in the diagram represents a width of 0.005. SLD: small loss deviation; SPD: small profit deviation.
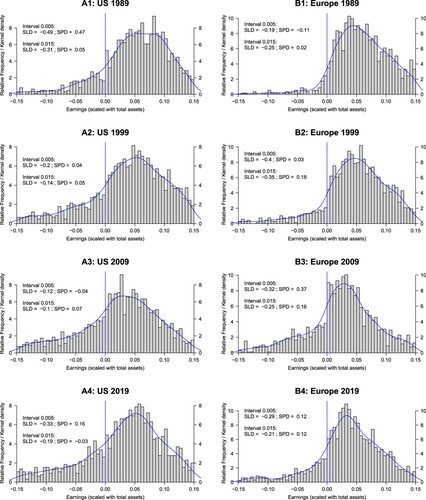
Figure 2. Discontinuity measures for the US and Europe for scaling with total assets.
The discontinuity measures capture the share of excess observations (pos. sign) or missing observations (neg. sign) in the intervals of scaled earnings directly below and above the zero threshold. SLD: small loss deviation; SPD: small profit deviation. Earnings are scaled with total assets at the beginning of the year.
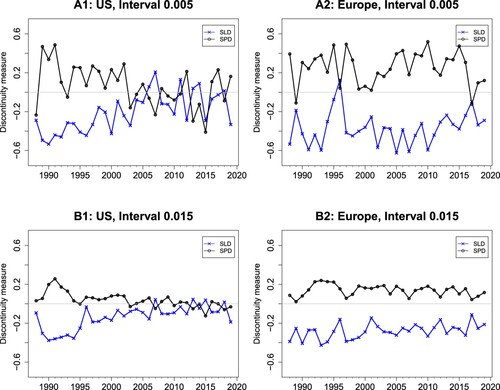
Figure 3. Results for matched industry samples.
Discontinuity measures analogous to Panels B1 and B2 in Figure (interval width 0.015). SLD: small loss deviation; SPD: small profit deviation.
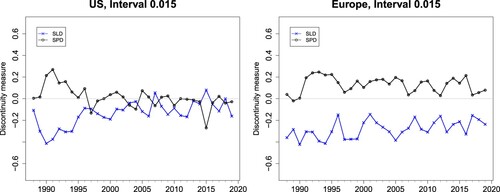
Table 2. Results of time-series regressions.
Figure 4. Comparison of small loss avoidance before and after European SOX.
SLD is the small loss deviation for an interval width of 0.015. The solid line is the regression line, the dashed line is the 45 degree line. The red diamond indicates the weighted average of the European countries (with the number of observations as weights). The country codes are defined in in the Appendix.
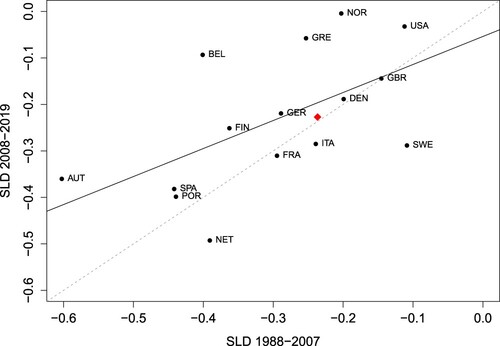
Table 3. Results of cross-country regressions.
Figure 5. Relationship of small loss avoidance with UAI and LTO.
Upper panels: UAI, lower panels: LTO. Left graphs cover the subperiod before European SOX (1988–2007), the right graphs cover the subperiod after European SOX (2008–2019). SLD is the small loss deviation for an interval width of 0.015 based on pooled data of the respective period. UAI is the Uncertainty Avoidance Index, LTO is Long-Term Orientation. The blue solid line (black dashed line) is the WLS (OLS) regression line. The red diamond indicates the weighted average of the European countries (with the number of observations as weights). The country codes are defined in in the Appendix.
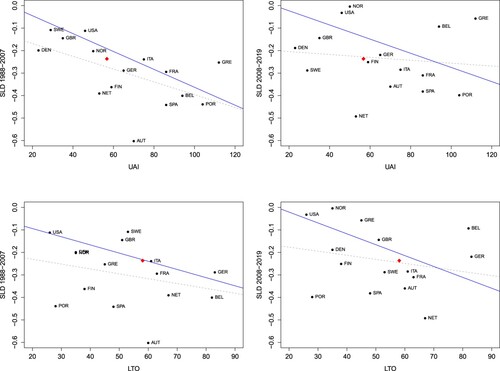
Table A1. Discontinuity measures in the US and European samples.
Figure A1. Discontinuity measures for the US and Europe for scaling with the market value of equity.
The discontinuity measures capture the share of excess observations (pos. sign) or missing observations (neg. sign) in the intervals of scaled earnings directly below and above the zero threshold. SLD: small loss deviation; SPD: small profit deviation. Earnings are scaled with the market value of equity at the beginning of the year.
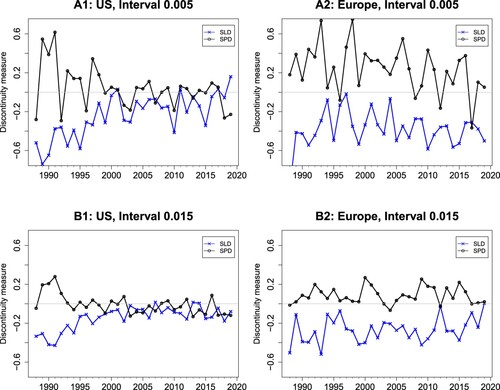
Table A2. Discontinuity measure and country characteristics before and after implementation of European SOX.