Figures & data
Table 1. The protein visualisation and 3D modelling software used in the development of the SSPME.
Table 2. The experimentally resolved data used in generating the 3D models of proteins during the development of the SSPME.
Figure 1. The 3D SARS-CoV-2 spike protein scene of the SARS-CoV-2 Spike Protein Mutation Explorer. Screenshots show the 3D SARS-CoV-2 spike protein embedded in the viral membrane (A) and the same scene when the user has rotated the model and is hovering their mouse over the NTD (B).
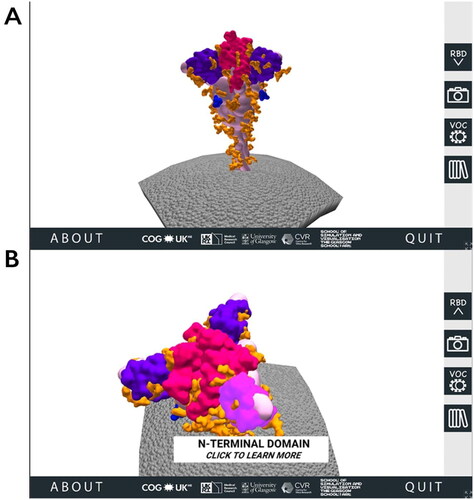
Figure 2. Accessing additional information through the SARS-CoV-2 Spike Protein Mutation Explorer. Screenshots show (A) the VOC menu, which is accessed via the right-hand side button which is labelled ‘VOC’ and contains an image of two simple viruses and (B) the Glossary panel, which is accessed from the bottom right-hand side button containing an image of books.
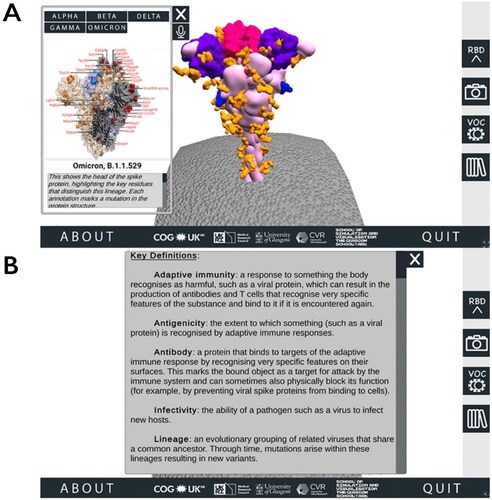
Figure 3. Information about Regions of Interest (ROI) in the SARS-CoV-2 Spike Protein Mutation Explorer. Screenshot shows the NTD-specific ROI page, one of the four ROI-specific pages, which is accessed by clicking the button labelled ‘NTD’ on the interactive 3D spike protein (see ). Going from top to bottom, the buttons along the right-hand side allow the user to hear the narrated text, alter the text size, access the animation and access the Glossary panel.
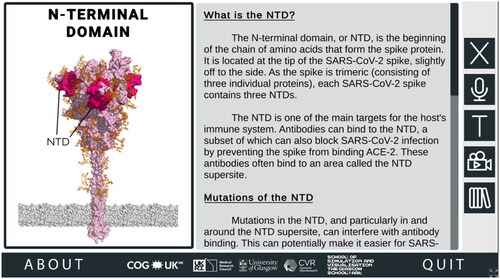
Figure 4. Explanatory animations in the SARS-CoV-2 Spike Protein Mutation Explorer. Screenshots show 3D molecular animations, which are contained within the RBD- and NTD-specific ROI pages of the SARS-CoV-2 Spike Protein Mutation Explorer, showing (A) SARS-CoV-2 virus particles and (B) a close-up SARS-CoV-2 spike protein avoiding host antibodies, with the antibody binding sites highlighted with a dashed line. Mucin proteins present in the nasal mucus are visible as background detail.
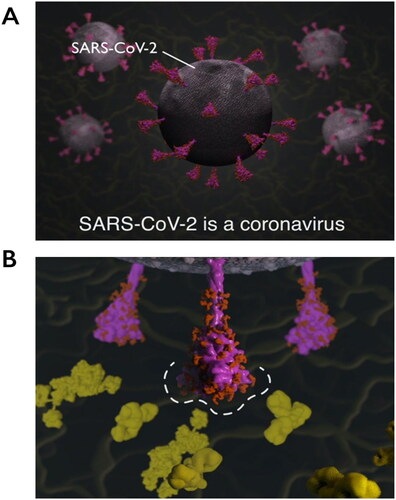
Table 3. The demographics collected from all participants within this study.
Figure 5. The flow of the seven stages of the experimental questionnaire.
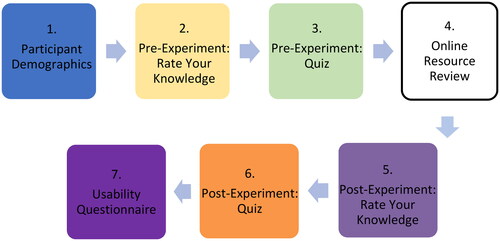
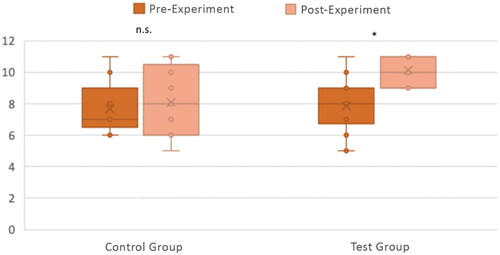
Figure 6. Knowledge acquisition with the CG (n = 9) and TG (n = 14). The number of correct answers out of 11 questions between the pre-and post-experiment quiz questions is shown for both the CG and TG, with individual responses plotted along with box and whisker plots. Differences between pre-and post-experiment were tested for significance with a Wilcoxon Signed Rank Test. *p < .005; n.s. p > .05.