Figures & data
Table 1. Patient profile with APHC (all-polyethylene horizontally cemented components) vs. MBHC (metalbacked horizontally cemented components) after randomization. MBHC/RSA denotes patient profile in group included in RSA after exclusions
Figure 1. All-polyethylene and metal-backed tibia components of the AGC pros-thesis. Both are non-modular, have identical articulating surface and are similar underneath. Stem geometry is identical.
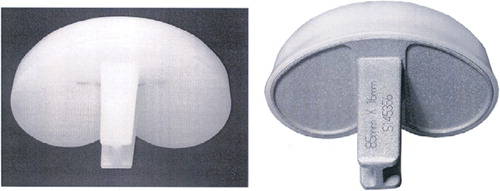
Figure 2. Standard anterior postoperative radiographs of the a) all-polyethylene, horizontally cemented (APHC), and b) metal-backed, horizontally cemented (MBHC) tibial components.
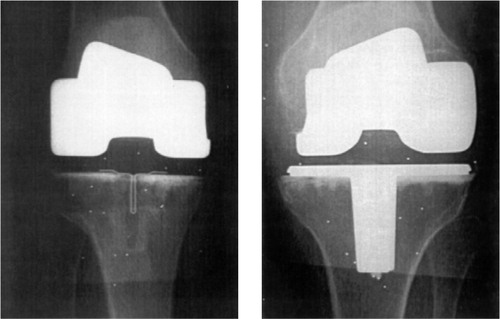
Table 2. Precision in actual set-up
Table 3. HKA (in degrees) 3 months postoperatively, for the separate groups. Figures denote number of individuals within each HKA interval
Table 4. Rotations along the 3 cardinal axes. Figures denote degrees
Figure 3. Box-plot illustrating subsidence of components in all-polyethylene, horizontally cemented (APHC) and metal-backed, horizontally cemented (MBHC) groups. There were no statistically significant differences. The line within the box denotes the median, the box represents the 25–75% range, and the whiskers represent non-outlier min and max. Extremes are marked “♦”.
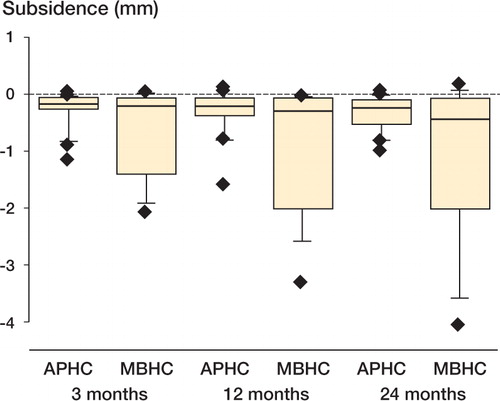
Table 5. Maximal total point motion (MTPM) in mm. Values are median (range)