Figures & data
Table 1. Original Merle d'Aubigné-Postel Score. The individual scores of Pain, Walking ability and Mobility are added together to give an overall numeric score. Clinical grades (Very good, Good, Medium, Fair, Poor) are given by the scores of Pain and Walking ability and adjusted down 1–2 grades, depending on the mobility score (D'Aubigne and Postel Citation1954). The total numeric score was used in our study
Table 2. Modified Merle d'Aubigné-Postel Score. The overall numeric score is given by adding the domain scores. Clinical grades: Excellent 18, Good 15–17, Fair 12–14, Poor 3–11 (Matta et al. Citation1986). The total numeric score was used in the present study
Table 3. The Harris Hip Score consists of the domains Pain, Function, Deformity and ROM, and gives a maximum of 100 points in the total score (Harris Citation1969)
Figure 1. The scatter plots between total numeric score of the Harris Hip Score and the original- and modified Merle d'Aubigné-Postel Scores show how well the scores conform to a straight line. Excellent correlations are apparent, but a defined value in one score may represent a considerable variation in the other score.
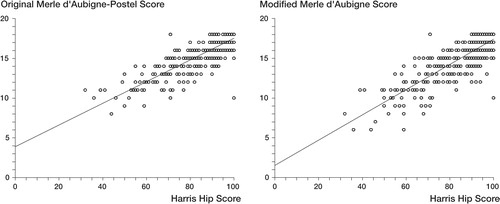
Table 4. Spearman correlation coefficients between the domains in the three different outcome scores
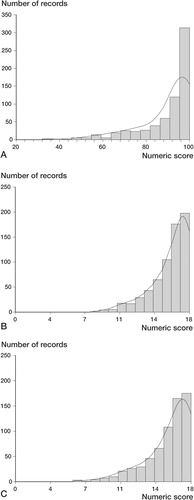
Figure 2. The distributions of the 661 records in the three outcome scores (A – Harris Hip Score, B – Original Merle d'Aubigné-Postel Score, and C – Modified Merle d'Aubigné-Postel Score) were skewed with a left tail and demonstrated a considerable ceiling effect for all three.