Figures & data
The oligonucleotide primers (Light Cycler primer/probe Set; Roche)
Figure 1. BMSCs were plated onto 6-well plates and cultured with and without rhBMP-2. Culture media from the different passages (P0–P5) of the BMP(+) and BMP(‐) groups were assayed for alkaline phosphatase (ALP) and osteocalcin (OC) as described in Material and methods. Data shown are the means (SEM) of six different samples, and were analyzed by unpaired Student’s t-test between the two groups (*p < 0.05). Both osteogenic markers were found to have significantly higher levels in the BMP(+) group than in the BMP(-) group (n = 6).
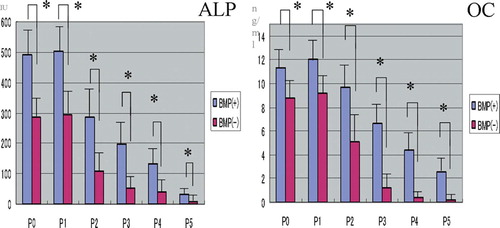
Figure 2. Electrophoresis of PCR products from real-time reverse transcriptase PCR analysis [OK?] of ALP and OC expression in cells at different passages (P0–P5), cultured with and without BMP-2 (A). The mRNA expression of ALP and OC was quantified as described in Material and methods (B). Data shown are the means (SEM) of 3 different samples, and were analyzed by unpaired Student’s t-test between the 2 groups (*p < 0.05). For passages P0–P4, the expression of mRNA for both osteogenic markers was significantly higher in the BMP(+) group than in the BMP(-) group (n = 3).
![Figure 2. Electrophoresis of PCR products from real-time reverse transcriptase PCR analysis [OK?] of ALP and OC expression in cells at different passages (P0–P5), cultured with and without BMP-2 (A). The mRNA expression of ALP and OC was quantified as described in Material and methods (B). Data shown are the means (SEM) of 3 different samples, and were analyzed by unpaired Student’s t-test between the 2 groups (*p < 0.05). For passages P0–P4, the expression of mRNA for both osteogenic markers was significantly higher in the BMP(+) group than in the BMP(-) group (n = 3).](/cms/asset/11c0ea27-52b7-4aeb-8160-aa9b97ae4f35/iort_a_11327302_f0002_b.jpg)
Figure 3. Radiographs of diffusion chambers with the cells (passages P0–P4) of the BMP(+) and BMP(-) groups at 4 weeks after transplantation. Numerous radioplaque configurations that indicate mineralized structures can be seen in the BMP(+) group compared to the BMP(-) group, although the numbers of calcifications decreased with passage in both groups. The figure shows one representative result from a total of 6 different samples at each passage.
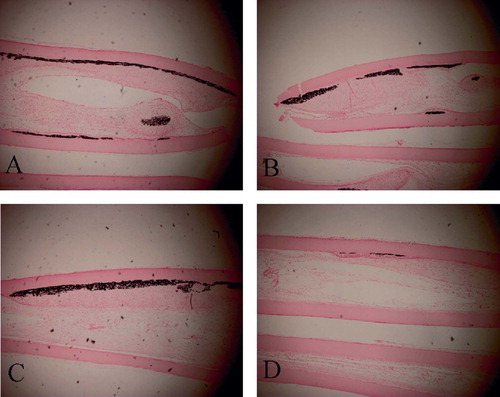
Figure 4. Photomicrographs of histological sections of the diffusion chambers with the BMP(+) group from passages P1(A), P2(B), P3(C), and P4(D) at 4 weeks after implantation. Massive cartilaginous tissue formations can [could?] be seen inside the chamber in the cells from passages P1–P3. (Alcian blue staining; original magnification 100×).
![Figure 4. Photomicrographs of histological sections of the diffusion chambers with the BMP(+) group from passages P1(A), P2(B), P3(C), and P4(D) at 4 weeks after implantation. Massive cartilaginous tissue formations can [could?] be seen inside the chamber in the cells from passages P1–P3. (Alcian blue staining; original magnification 100×).](/cms/asset/ee3a204b-5b7a-4bd3-9ed0-6ba377ede7d7/iort_a_11327302_f0004_b.jpg)
Figure 5. Photomicrographs of histological sections of the diffusion chambers with the BMP(+) group from passages P1(A), P2(B), P3(C), and P4(D) at 4 weeks after implantation. Abundant calcium depositions at the membrane were observed in cells from passages P1–P3. (Von Kossa staining; original magnification 100×).