Figures & data
Figure 1. Flow diagram showing details of the literature search, including articles excluded at each stage of the review.
Table 1. Characteristics of the studies included (n = 20)
Table 2. Comparisons of fixation strategies and comparative survivorship results
Table 3. Results of meta-analysis
Figure 2. Forest plot of cemented vs. uncemented fixation survivorship difference for type A studies (where failure is defined as revision of either or both components). Shaded boxes represent study-specific estimates with area proportional to sample size and attached horizontal lines representing 95% CIs. The diamond at the bottom represents combined random effects estimate. Positive numbers (< 0) favor uncemented implant fixation and negative numbers (< 0) favor cemented implant fixation. The Danish registry reported on by Lucht et al. (Citation2000) is entered twice because of stratification of results of patients into age groups of ≤ 55 years and < 55 years, but does not require adjustment of weights because the comparisons are independent.
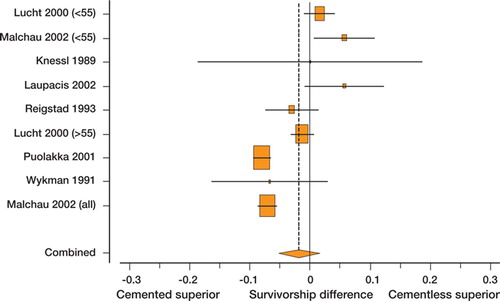
Table 4. Meta-analysis by selected subgroups (95% CI)
Figure 3. Forest plot of cemented vs. uncemented fixation survivorship difference for type B studies (where failure is defined as revision of a specific component—cup or stem). Shaded boxes represent study-specific estimates with area proportional to study size and attached horizontal lines representing 95% CIs. The diamond at the bottom represents combined random effects estimate. Positive numbers (< 0) favor uncemented implant fixation and negative numbers (< 0) favor cemented implant fixation.
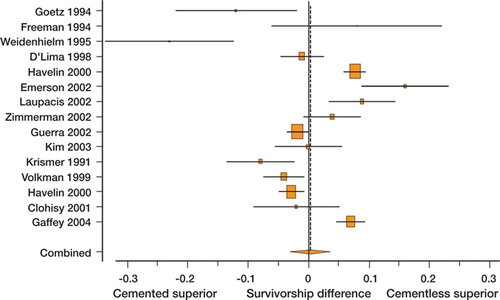
Figure 4. Sensitivity analysis of pooled estimate of type B studies (where failure is defined as revision of a specific component—the cup) to omission of each individual study. Positive numbers (< 0) favor uncemented implant fixation and negative numbers (< 0) favor cemented implant fixation.
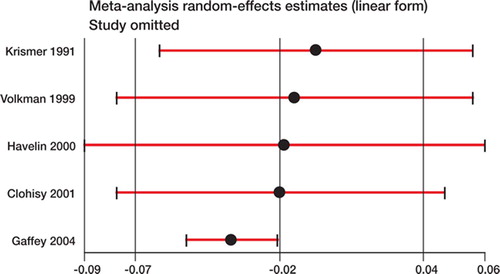
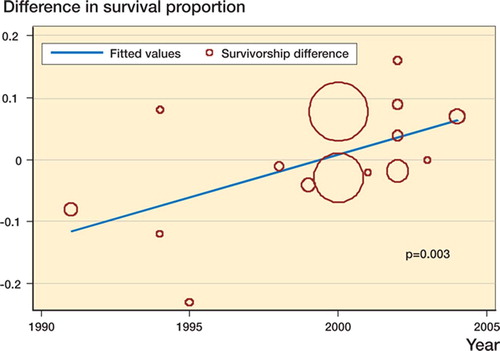
Figure 5. Scatter plot of study estimate of the difference in survival probability vs. year of publication with superimposed regression line. Y-axis values greater than zero favor uncemented fixation and the area of each circle is proportional to the sample size of the study. Slope = 1.4% per year (95% CI: 0.5–2.3)