Figures & data
Figure 1. Ceramic acetabular model (L: lateral, C: central) and a 52–mm demonstration Opticup.
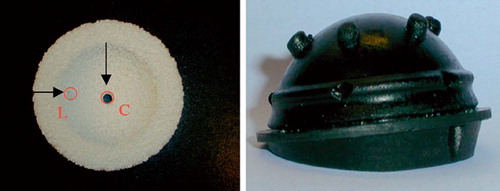
Figure 2. Set–up of the ceramic model during initial pressurization.
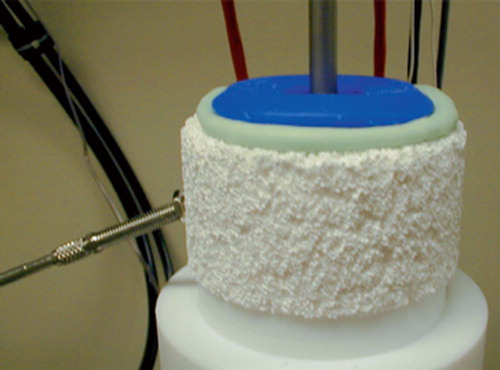
Table 1. Groups of ceramic acetabular models
Figure 3. Photograph showing the cut ceramic acetabular model with cemented demonstration Opticup. PD (↔): depth of cement penetration, PT: pressure transducer.
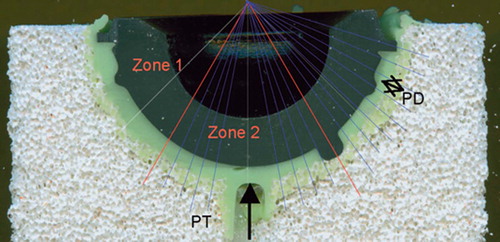
Figure 4. Viscosity profile of Palacos R bone cement.
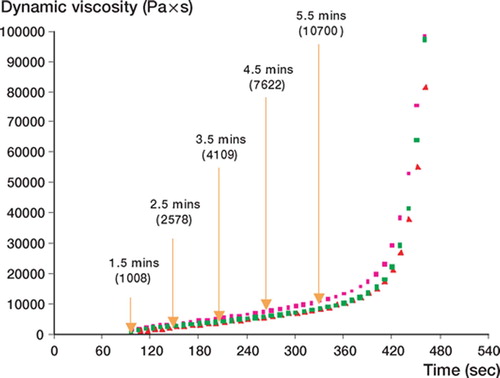
Figure 5. Pressure profile during cement pressurization (*) and cup insertion (**) in (A) group 1 (with initial cement pressurization at 2.5 minutes), and (B) group 2 (with cup introduction at 4.5 min).
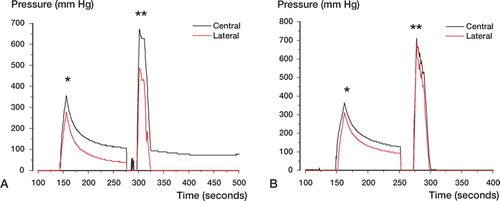
Figure 6. Average peak pressure measurements in the central and lateral zones during cup introduction in group 1.
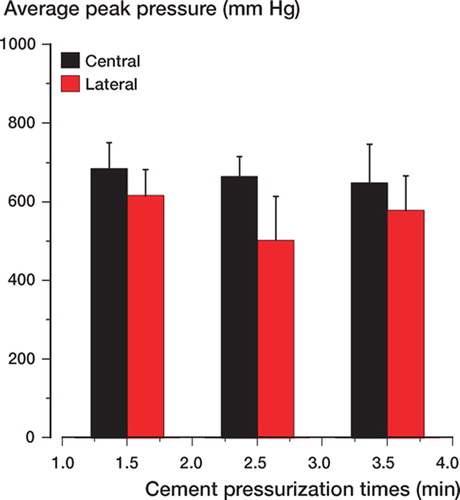
Figure 7. Average peak pressure measurements in the central and lateral zones during cup introduction in group 2.
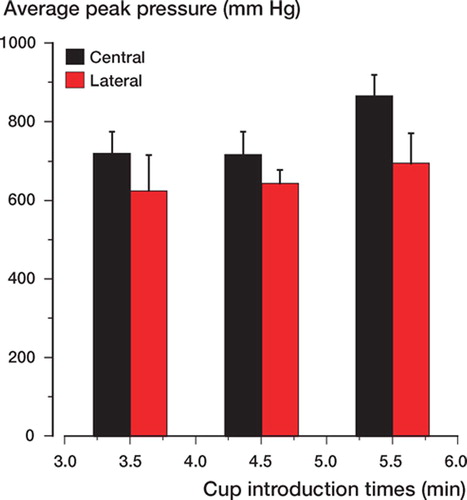
Figure 8. Average cement penetration depth in the central and lateral zones during cup insertion in group 1.
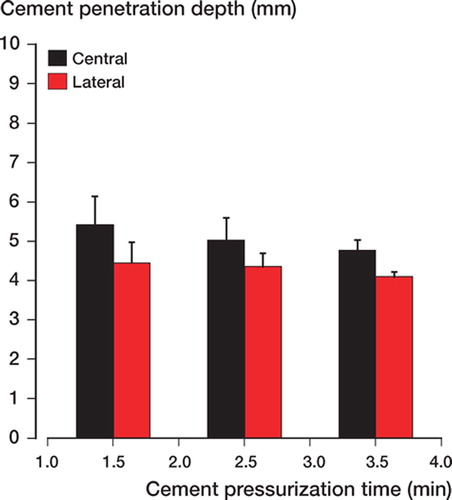
Figure 9. Average cement penetration depth in the central and lateral zones during cup introduction in group 2.
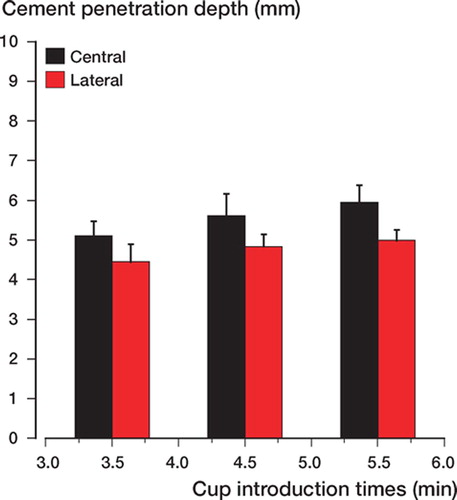
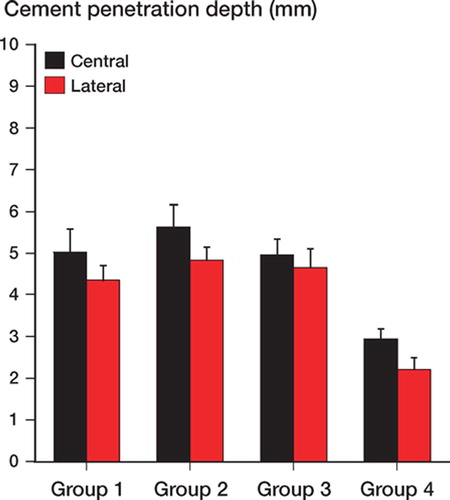
Figure 10. Comparison of penetration depth in groups 1–4 with common time points. Group 1: onset of cement pressurization 2.5 min; cup introduction time 5 min. Group 2: onset of cement pressurization 2.5 min; cup introduction 4.5 min. Group 3: onset of cement pressurization 2.5 min; no cup introduction. Group 4: onset of cup introduction 4.5 min; no initial pressurization.