Figures & data
Table 1. Bone mineral density (BMD) in vivo measured by DXA at different sites before and 2, 3, and 6 weeks after induction of a tibial midshaft fracture on the right side. BMD of the intramedullary nail was measured in vitro and subtracted from the in vivo BMD values of right tibia. The left limb was used as an internal control. Values are mean (SD)
Table 2. Right-left comparison of bone mineral density (BMD) in vivo 2, 3 and 6 weeks after induction of a tibial midshaft fracture on the right (R) side. BMD of the intramedullary nail was measured in vitro and subtracted from the in vivo BMD values of right tibia. The left limb (L) was used as an internal control. Values are mean (SD)
Table 3. Comparison of biomechanical properties of callus and long bones in Ovx-D and Sham groups examined in a 3-point cantilever bending test. A standardized fracture was performed in the tibial midshaft on the right side of all animals, and fixed with an intramedullary nail. The nail was removed prior to mechanical testing. The left limb was used as an internal control. Values are mean (SD)
Figure 1. Light microscopic pictures of sections of femoral head with a magnification of 2.5×. Panel A, from an Ovx-D rat, shows substantial loss of trabecular bone and trabecular connectivity compared to panel B, which was taken from a Sham rat.
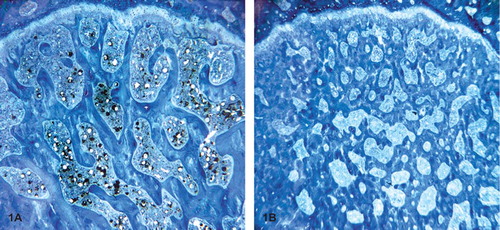
Figure 2. Trabecular bone volume density (VvTB) in the femoral head was significantly lower in the Ovx-group than in the Sham group, both 3 and 6 weeks after tibial shaft surgery. After 3 weeks, n = 14 in both right and left leg; after 6 weeks, n = 11/12 and 8/9 with respect to Ovx and Sham. * p < 0.001
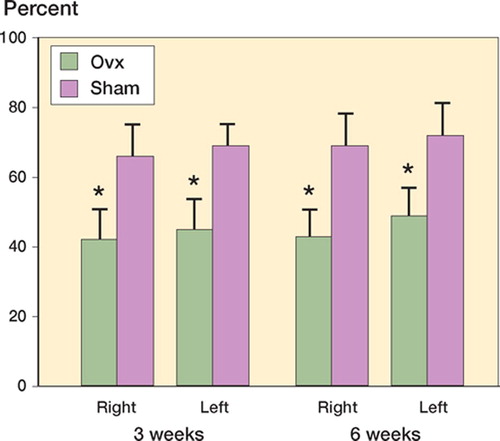
Table 4. Histomorphometry on tibial and femoral diaphyses 3 and 6 weeks after induction of tibial midshaft fracture. Values are mean (SD) × 10-1