Figures & data
Histological grading scale
Figure 1. Effect of collagen matrix on cartilage repair. Transverse sections of collagen (-) defect (A, C, E, G, I, K, and M) and collagen (+) defect (B, D, F, H, J, L, and N). (A) and (B) show the defects at the first postoperative week. Arrows indicate the regions where there is an abundance of spindle-shaped cells. (C) and (D) show the defects at the second week. Arrowheads indicate the initial site of proteoglycan production. (E) and (F), (G) and (H), (I) and (J), (K) and (L), and (M) and (N) show those at the fourth, eighth, twelfth, and twenty-fourth week, respectively. Note the collagen(-) defect does not produce sufficient cartilage matrix, whereas the collagen(+) defect succeeds in resurfacing of the articular cartilage (toluidine blue).
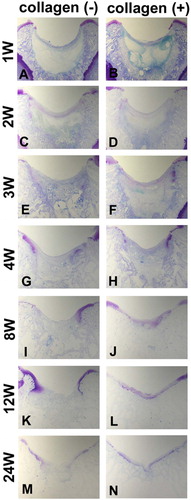
Figure 2. Histological evaluation using Wakitani's histological grading score (Wakitani et al. Citation1998). The collagen (+) defect is repaired with cartilage tissue of superior quality as compared to the collagen (–) defect. However, the grading score of the collagen (+) defect does not improve after the eighth postoperative week. Data are shown as mean ± SD. Asterisks indicate statistical significance (Student's t-test, p < 0.05).
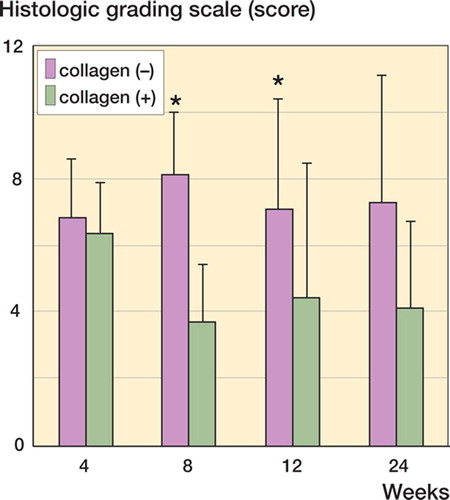
Figure 3. Total number of cells under different repair conditions. The total cell number distributed in the collagen (–) and collagen (+) defects display distinct time courses. There is an early increase in cell number in the collagen(+) defect at the second week (asterisk), followed by a decrease to a level comparable to that of the collagen (–) defect. Data are shown as mean ± SD. Asterisk indicates a significant difference (Student's t-test, p < 0.05).
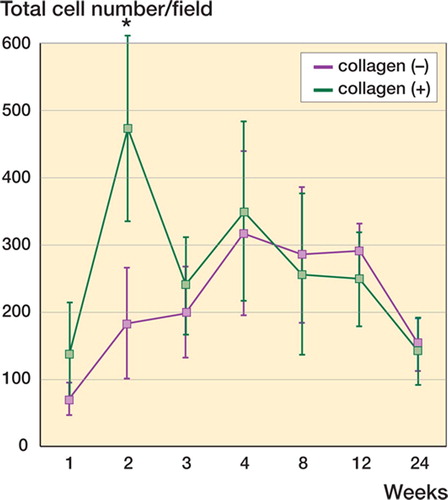
Figure 4. BrdU-positive cells during different phases of cartilage repair. Proliferating cells are identified by BrdU technique: (E), (F), (G), and (H); 200× magnification. Hematoxylin and eosin stained sections of corresponding regions are shown to demonstrate cellularity of the each condition: (A), (B), (C), and (D); 100× magnification.
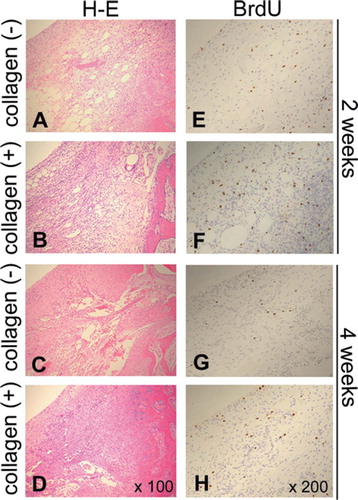
Figure 5. The central and peripheral regions for localization of proliferating cells. To characterize the cells responsible for the early increase in cell number (asterisk, ), the distribution of proliferating cells was studied using BrdU staining. For detailed localization of cells, the cartilage defect was divided further into the central and peripheral regions.
Figure 6. Spatiotemporal distribution of the proliferating cells. BrdU-positive cells were counted in the central and peripheral regions. Densities of proliferating cells are presented as cells/field for collagen(-) defects and collagen(+) defects. Data are shown as mean. Bars indicating SD are omitted for simplicity. Asterisk indicates significant differences between peripheral regions in collagen(+) and collagen(-) defects (Student's t-test, p < 0.05).
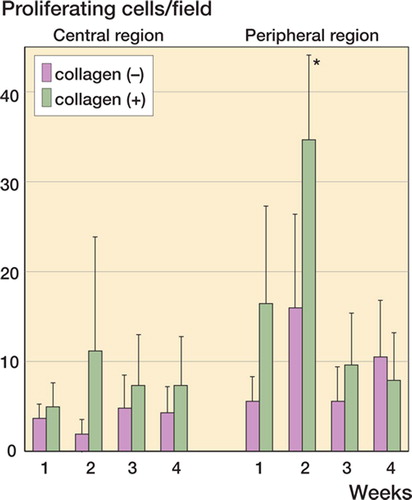
Figure 7. Recruitment assay on the bone marrow-derived mesenchymal stem cells and chondrocytes. (A) Scheme of in vitro migration assay. Different concentrations of collagen were used to coat the lower surfaces of porous membranes. Cells were seeded on the upper surface and those that migrated to the lower surface were counted. (B) Microscopic appearance of the migrated cells. (C) Numbers of migrated mesenchymal cells and chondrocytes at different concentrations of substrate-bound collagen. Data are expressed as mean ± SD. Asterisk indicates a statistically significant difference between mesenchymal cells and chondrocytes (Student's t-test, p< 0.05).
Figure 8. Characterization of the cell types recruited by collagen. Combinations of cell-surface markers are used to identify the mesenchymal stem cells (MSCs), and the CD44-positive and CD45-negative cells are considered to be the marrow-derived MSCs. Immunofluorescent detection of CD44 (A), CD45 (C), and BrdU (E). B. double staining of CD44 (red) and CD45 (green). F. triple staining of CD44 (red), CD45 (green), and BrdU (blue). Approximately half of the BrdU-positive cells are CD44-positive and CD45-negative (white circles), indicating that a considerable proportion of the recruited cells are MSCs that still retain their mitotic activities. D. phase-contrast view.
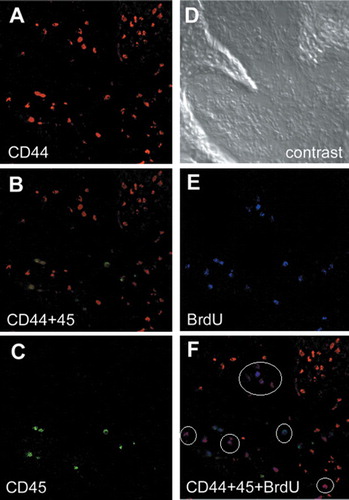
Figure 9. Apoptotic cell distribution during chondrogenesis. Densities of TUNEL-positive cells during cartilage repair. For both the collagen (–) and collagen (+) defects, there are sharp increases in numbers of TUNEL-positive cells at the second postoperative week, followed by a decrease during the second to eighth postoperative week. Since the amount of TUNEL-positive cells is not altered by the use of collagen, it is likely that the collagen usage does not affect differentiation activity. Data are expressed as mean ± SD.
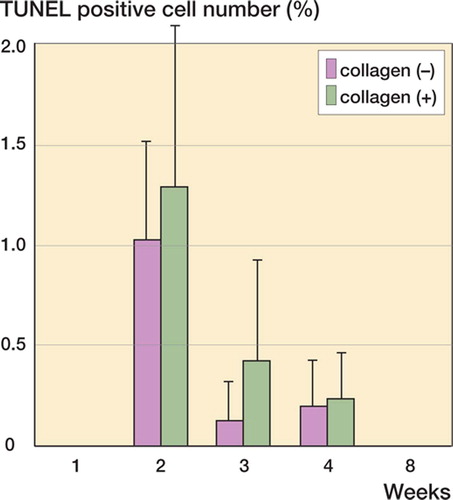
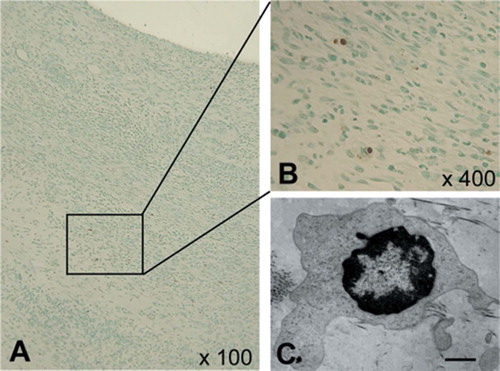
Figure 10. Confirmation of apoptotic cells. A and B: TUNEL staining sections showing the localization of apoptotic cells; 100× and 400× magnification, respectively. The rectangle indicates the area of panel B. C: Electron microscopy showing findings compatible with apoptosis (bar represents 1.0 μm).