Figures & data
Figure 1. Both techniques of ACL reconstruction, using the pediculated tendon of the extensor digitorum longus (a), and using the free bone-tendon-bone autograft from the central third of the patellar ligament (b).
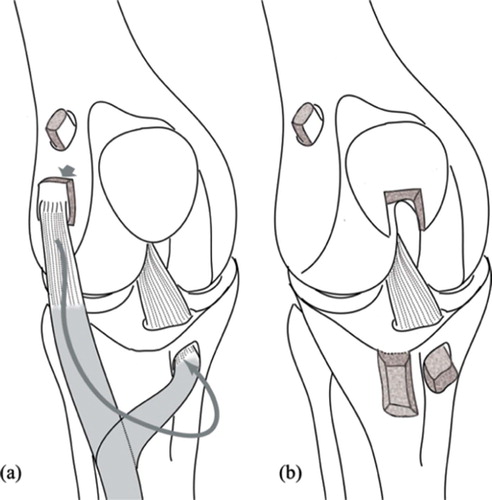
Figure 2. Neurophysiological data for analysis (summed PSTH/bin). Slope of the mean activity (electrical activity counts against time) is obtained on PSTH/bin charts.
Figure 3. Charts showing mean ± SD firing activity (PSTH, units/bin) for MAN, PAN, quadriceps and hamstrings, during anterior tibial translation at 90° and 30° knee flexion, flexion, and extension. Comparisons by Mann-Whitney test after Bonferroni adjustment are included (*p <0.0125).
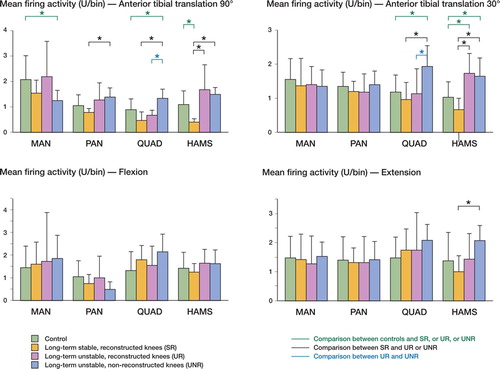
Figure 4. Charts showing mean ± SD slope (adimensional variable) for MAN, PAN, quadriceps and hamstrings, during anterior tibial translation at 909 and 309 knee flexion, flexion, and extension. Comparisons by Mann-Whitney test after Bonferroni adjustment are included (*p <0.0125).
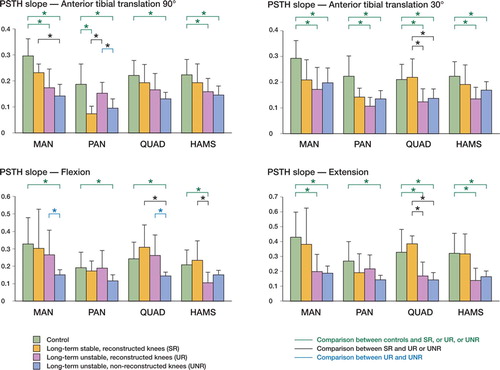
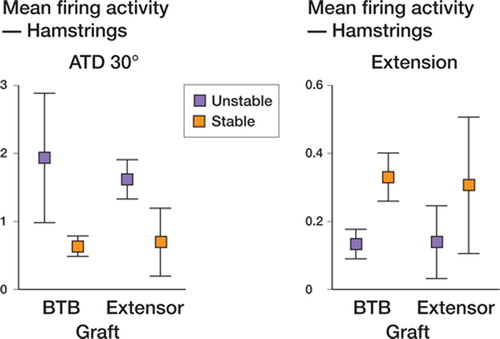
Figure 5. Mean firing activity and PSTH slope in hamstrings recordings at ATT 30° flexion and during extension, to observe the contribution of graft type and stability, after two-way ANOVA analysis.
Effect of graft and/or stability on mean firing activity and PSTH slope in reconstructed knee. Two-way ANOVA for mean values of activity and slope in reconstructed knees. P-values are given when p <0.05