Figures & data
Figure 1. Photomicrographs of subchondral bone immu-nostained with anti-BMP-2. A. Subchondral bone of the necrotic femoral heads untreated with shock waves: slight BMP-2 immunoreactivity (BMP-2-IR) was found in osteo-blasts and fibroblastic cells. B. 4 weeks after application of shock waves, the osteoblasts and the fibroblastic cells showed an increased level of BMP-2-IR. C. 8 weeks after shock wave application, BMP-2-IR was increased in the fibroblastic cells of the vascular granulation tissue invading the necrotic bone. Bone matrix also showed BMP-2-IR. D. 12 weeks after shock wave application, BMP-2-IR was observed in the trabecular bone and the marrow. Osteoblasts adjacent to the newly formed woven bone showed intensive expression of BMP-2. E. BMP-2-IR was absent when the primary antibody was replaced with PBS or non-immune mouse serum. (All images ×200).
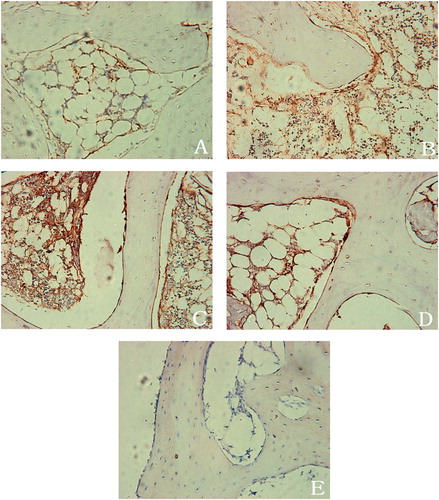
Figure 2. Gene expression of BMP-2 in shock wave-treated femoral heads (red bars) and in untreated femoral heads (blue bars) at 24 h and 1, 2, 4, 8, and 12 weeks after the application of shockwave treatment, as determined by realtime quantitative RT-PCR.The graph demonstrates the fold change (and range) for each experimental group when the untreated femoral head of 24 h was normalized to 1. The asterisks indicate statistically significant differences between shock wave-treated femoral heads and untreated femoral heads at the indicated time point. SW: shock wave-treated femoral head; control: untreated femoral head.
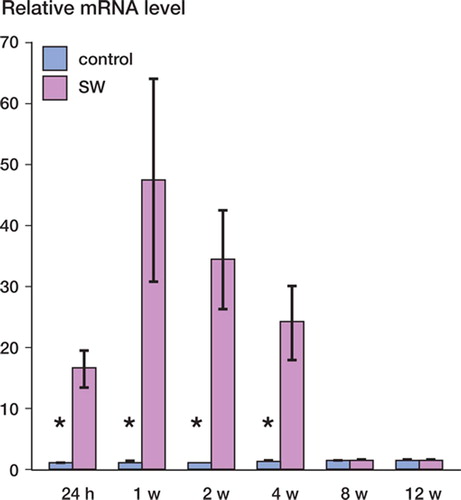
Figure 3. A. Western blot analysis of subchondral bone samples obtained from necrotic femoral heads at 24 h and 1, 2, 4, 8, and 12 weeks after the application of shock-wave treatment. (Lanes 24h, 1wk, 2wks, 4wks, 8wks and 12wks represent 24 hours and 1, 2, 4, 8, and 12 weeks, respectively). Western blot analysis consistently showed increased BMP-2 expression at 1, 2, 4, and 8 weeks compared to the samples from the untreated control femoral heads. B. Graph showing densitometric analysis of western blot, normalized to the density of β-actin in each lane. The asterisks indicate statistically significant differences between shock wave-treated femoral heads and untreated femoral heads at each time point. SW: shock wave-treated femoral head. Control: untreated femoral head.
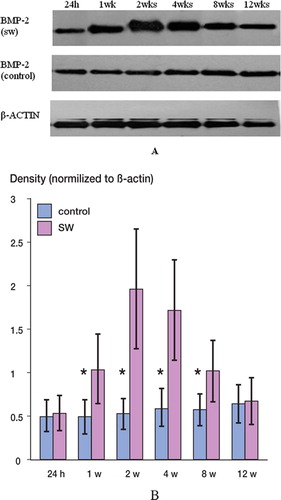
Figure 4. A. Under epifluorescent light, the tetracy-cline labels in shock wave-treated femoral heads were intense and the distances between two lines were wide (×100). B. Under epifluorescence, the tetracycline labels in untreated femoral head were weak and the distances between two lines were narrow (×100). C. Graph showing the calcification deposition rate of shock wave-treated femoral heads (red bars) and untreated femoral heads (blue bars). The asterisks indicate statistically significant differences between shock wave-treated femoral heads and untreated femoral heads at each time point. SW: shock wave-treated femoral head; control: untreated femoral head.
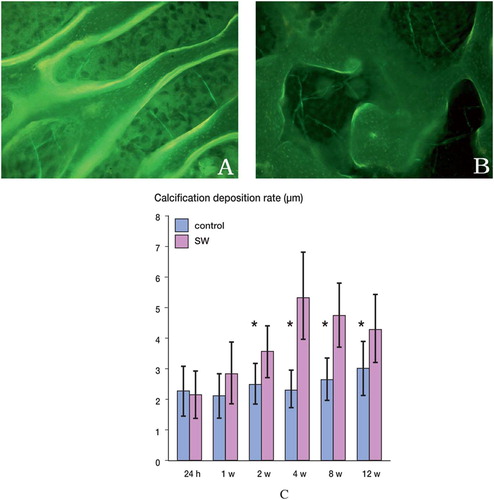
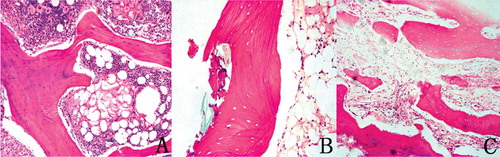
Figure 5. Histological findings in the femoral head following injection of methylprednisolone and lipopolysaccharide in rabbits. Mid-coronal section from rabbit femoral head 6 weeks after the injection, stained with hematoxylin-eosin. A. Marrow necrosis (x100). B. Trabecular necrosis (x200). C. Trabecular necrosis and dense medullary fibrosis (x100).