Figures & data
Figure 1. The experimental procedure. Blood was drawn off from each rabbit and anticoagulant was added. PRP was separated by a two-step centrifugation procedure. The necrotic bone was wrapped with a silicon sheet after injection of 1 ml of PRP into the hole, and it was then placed subcutaneously in the thigh.
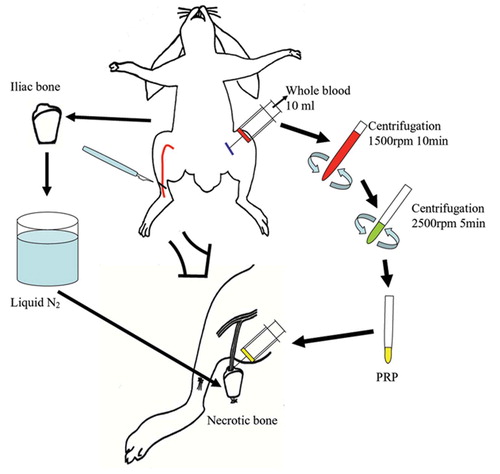
Figure 2. Microangiography 1 week after surgery; newly formed vessels could be seen along the implanted vascular bundle in the control group (left panel) and in the experimental group (right panel).
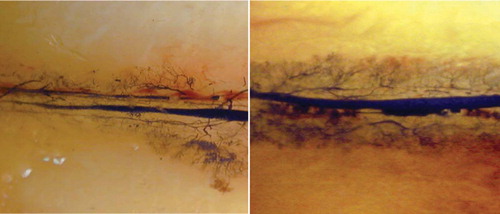
Figure 3. Microangiography 2 weeks after surgery; newly formed vessels could be seen along the implanted vascular bundle in the control group (left panel) and in the experimental group (right panel).

Figure 4. Mean angiographic score at 1 and 2 weeks after surgery. 1 week after surgery, that of the experimental group was 0.31 (SE 0.039), higher than that of the control group (0.18 (SE 0.039)) (p = 0.05). This difference was maintained at 2 weeks, when the mean angiographic score of the experimental group was 0.54 (SE 0.033) and that of the control group was 0.34 (SE 0.063) (p = 0.02).
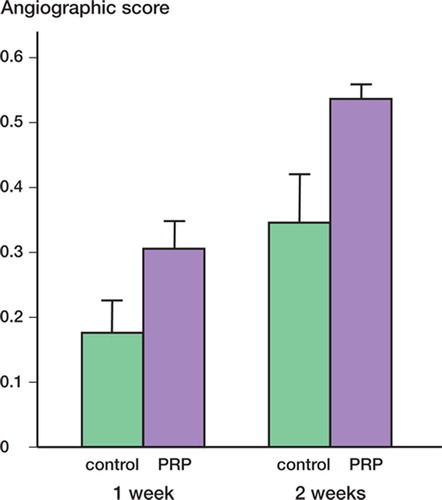
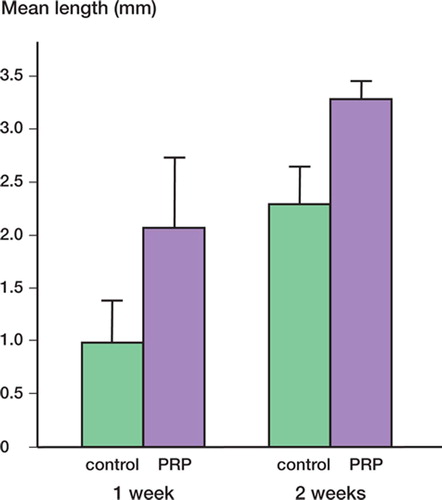
Figure 5. Mean length of newly formed vessels at 1 and 2 weeks after surgery. 1 week after surgery, the length of newly formed vessels in the experimental group (2.07 mm (SE 0.65)) was significantly greater than in the control group (0.98 (SE 0.32)) (p = 0.03). At 2 weeks, the mean vessel length in the experimental group was 3.3 (SE 0.16) and it was 2.3 (SE 0.3) in the control group (p = 0.01).