Figures & data
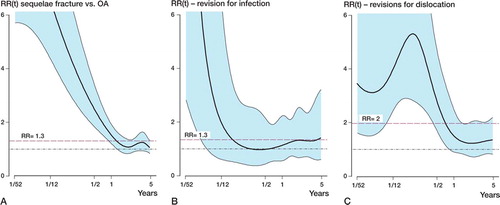
Figure 2. Time dependent relative risks (RRs) of revision, with 95% confidence intervals, for prostheses in patients with sequelae after femoral neck fractures compared to prostheses in OA patients. The horizontal red dotted line indicates overall RR. The horizontal black line represents the risk of revision in OA patients. The x-axis is logarithmic. The curves show an increased overall RR of revison due to any cause during the first year (A), an increased RR for revision due to infection during the first 2 weeks (B), and an increased RR for revision due to dislocation during the first year (C).