Figures & data
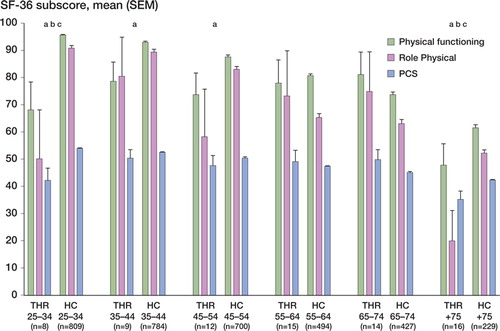
Figure 1. Flow chart showing progress through the different phases of the study.
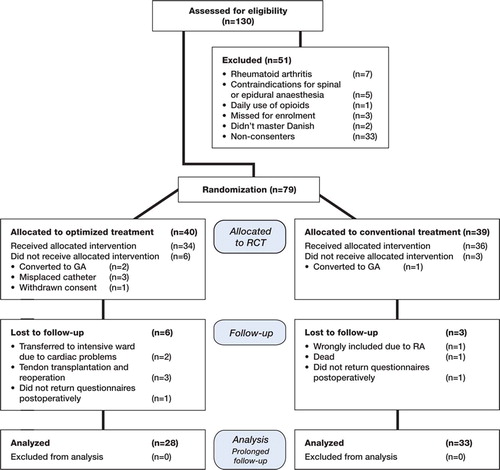
Figure 2. Daily time out of bed (in min) during the first 6 postoperative days after admission in the two groups (mean and SEM). a = p ≤ 0.05; b = p ≤0.01.
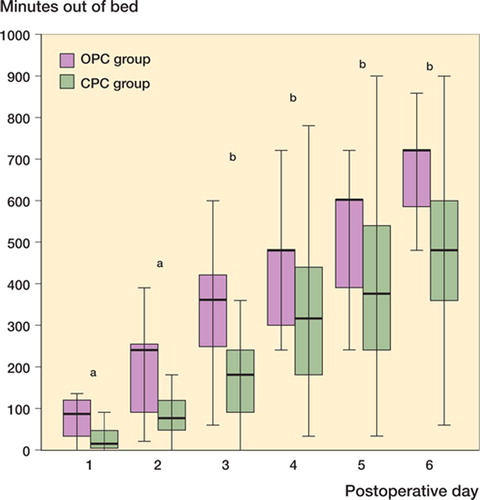
Table 1. Overall comparison of demographics and perioperative data for the study population
Table 2. Changes in WOMAC and SF 36 scores between baseline and follow-up 3 and 6 months postoperatively. Differences in changes over time baseline and 3 months; baseline and 6 months between groups were analyzed and tested for statistically significant differences by a repeated measurements model
Table 3. Psychometric properties of WOMAC and SF-36 at baseline and at follow-up 3 and 6 months postopera-tively, showing the number of patients with the lowest score (floor effect) and the number of patients with the highest score (ceiling effect). Study population was 61 patients
Figure 3. Scores of THR patients and healthy controls in the SF-36 subscales physical functioning (PF), role physical (RP), and physical component summary scale (PCS) broken down according to patient age (age groups according to Bjorner et al. (Citation1997)). Scores are presented as mean an SEM. Statistically significant differences in mean scores between patients and controls are shown as follows: a = PF: p < 0.05; b = RP: p < 0.05; c = PCS: p < 0.05.