Figures & data
Table 1. Arthroplasty patients managed by local infiltration analgesia in the period 2005–2006
Figure 1. Pain catheter placement in total knee replacement. The catheter is led along the medial femoral condyle, usually on raw bone, medial to the metal femoral component. Using artery forceps, it is then passed posterior to the medial femoral condyle so that the tip lies in front of the posterior capsule.
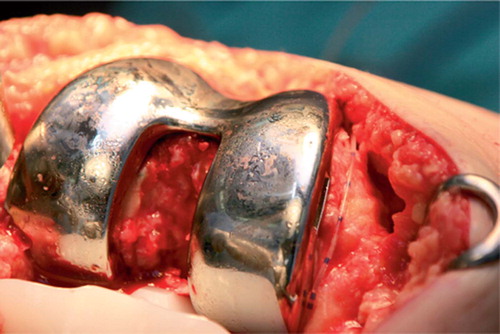
Figure 2. Pain catheter placement in hip resurfacing arthroplasty. The pain catheter is advanced to the superior apex of the wound and placed with forceps above the pyriformis tendon such that its tip lies within the capsule antero-superior to the joint. The slack is then taken up so that the catheter lies over the long axis of the wound, in the plane over the external rotator muscles
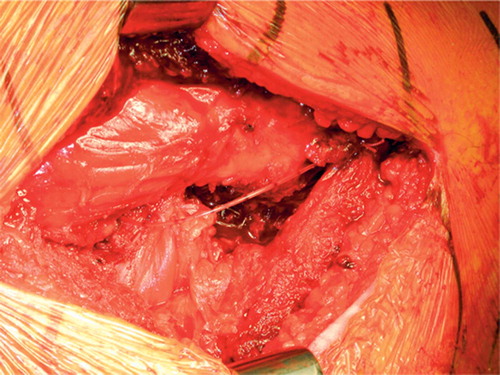
Table 2. Pain scores recorded on postoperative day 0 at 4 h after time zero, postoperative day 1 approximately 15–22 h after time zero, and postoperative day 2 approximately 40–48 h after time zero for each operation category
Table 3. Morphine usage over the first 48 h postoperatively by patients presenting between Jan 1, 2005 and Dec 31, 2006. Proportion of patients in each category. Dose in parentheses is average total dose in mg over 48 h for each category
Table 4. Mobilization times. Values are time intervals from time zero (first injection of RKA mixture for hips or tourniquet release for knees) to first walk (time W1) and to independent mobility (time IM). Values are mean (SD) [range] hours
Table 5. Length of stay in hospital