Figures & data
Table 1. Diagnoses
Table 2. Breakdown of patient numbers according to Charnley categories. A: unilateral hip disorder; B: bilateral hip disorder; C: other conditions directly impeding mobility
Figure 1. The Zweymüller SL stem.
Figure 2. The Endler metal- (c.p. titanium-) backed screw cup.
Figure 3. Frontal radiograph with Gruen femoral zones 1–7 and De Lee-Charnley acetabular zones I—III. Polyethylene wear was estimated along a line from the superior to the inferior edge margins of the cup. The distances from the superior (A) and the inferior (B) edge margins to the femoral head were measured with a manual calliper. Linear wear was calculated using the formula (A-B) /2.The measurements were corrected for magnification using the 32-mm diameter of the femoral head.
Table 3. Characteristics of the reoperated hips
Figure 5. Kaplan-Meier estimated survival curves, both components, all revisions.
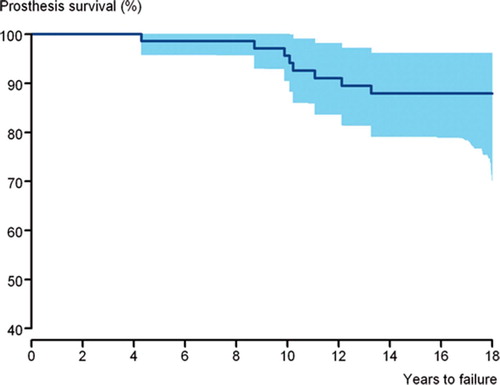
Figure 6. Kaplan-Meier estimated cup survival curves, all revisions.
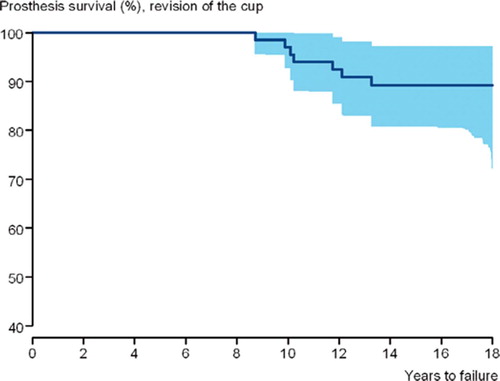
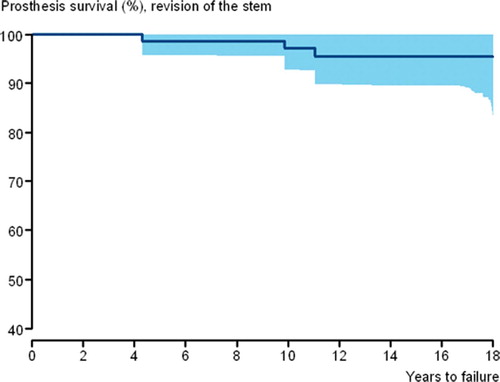
Figure 7. Kaplan-Meier estimated stem survival curves, all revisions.