Figures & data
Figure 1. Number of TRAP-positive MNCs in culture. Particles were added to precursor osteoclasts, mature osteo-clasts, or end-stage osteoclasts, and a corresponding culture system without PMMA particles served as a control. The results are expressed as the number of TRAP-positive MNCs per mm2 ± SD. The particle-stimulated mature osteoclasts had an increased number of TRAP-positive MNCs at days 8 and 12 compared to the control group, the particle-stimulated precursor osteoclasts, and particle-stimulated end-stage osteoclasts at the same time points. (Asterisk denotes significance at the p < 0.05 level).
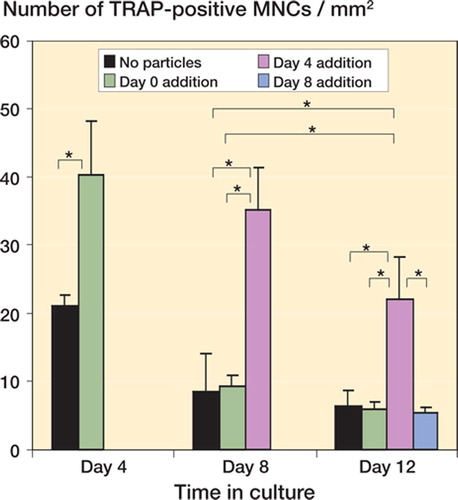
Figure 2. Percentage of resorbed bone surface. Particles were added to precursor osteoclasts, mature osteoclasts, or end-stage osteoclasts while one group with no particles added served as a control. The results are expressed as percentage of the bone slice surface occupied by resorp-tion pits ± SD. The particle-stimulated mature osteoclasts had a significantly higher percentage of the bone surface occupied by resorption pits at day 8 and day 12, compared to all other groups. (Asterisk denotes significance at the p < 0.05 level).
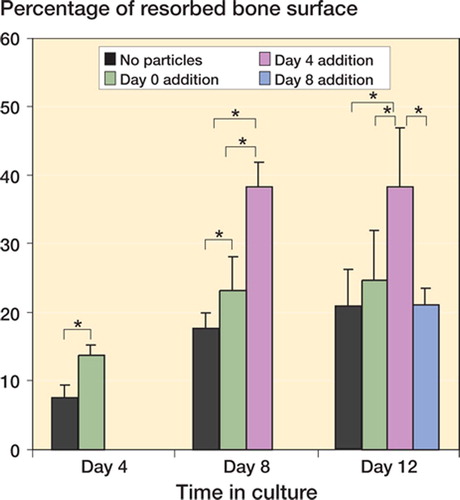
Figure 3. Light microscope image of TRAP-positive mononuclear and multinucleate cells at (A) day 4 in the control group, and (B) day 4 in the particle-stimulated precursor osteoclasts (450× magnification).
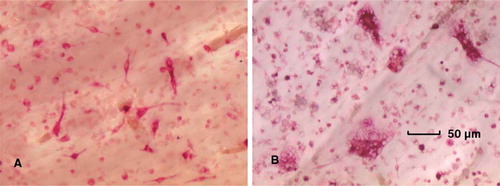
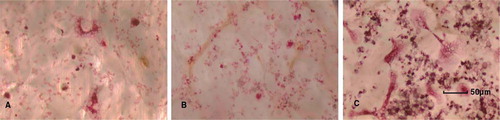
Figure 4. Reflectance microscope image of bovine bone slices. Bone resorption pits appeared as a dark shade on the gray scale. Images were taken (A) at day 12 in the control group, (B) at day 12 in the particle-stimulated precursor osteoclasts, (C) at day 12 in the particle-stimulated mature osteoclasts, and (D) at day 12 in the particle-stimulated end-stage osteoclasts (200× magnification).
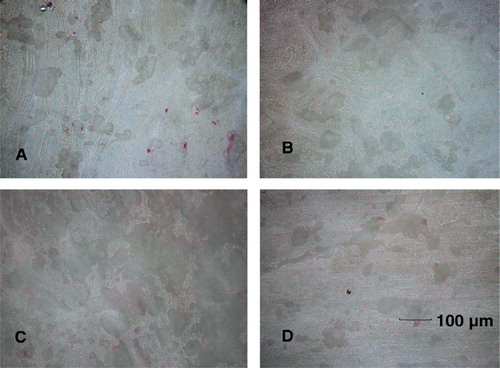
Figure 5. Light microscope image of TRAP-positive mononuclear and multinucleate cells in (A) the control group at day 8, (B) the particle-stimulated precursor osteoclasts at day 8, and (C) the particle-stimulated mature osteoclasts at day 8 (450× magnification).