Figures & data
Table 1. Breakdown of patients analyzed
Figure 1. Frequency distribution of the length of the migration vector, postoperatively to 2 years. Blue lines indicate observations. Green and red lines indicate the estimated distributions under the assumption that the material consists of one or more groups with log‐normal distribution. Red triangles represent the means of the 2 subgroups.
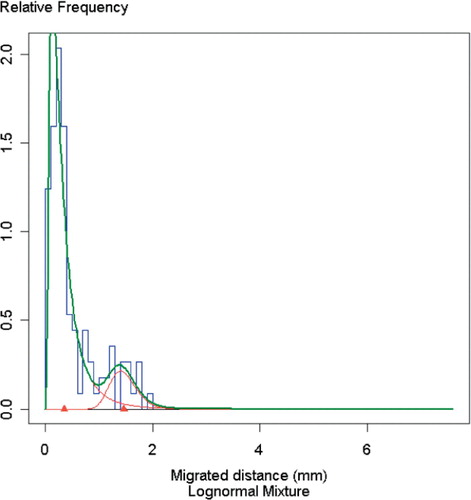
Table 2. Conditional probabilities of a cup being of a certain type, belonging to a man, a woman, or a certain operating department, given that its migration (vector 0–2 year) is below or above the cut‐off point
Figure 2. Frequency distribution of the length of the migration vector from 1 to 2 years. Blue lines indicate observations. Green and red lines indicate the estimated distributions under the assumption that the material consists of one or more groups with log‐normal distribution. Red triangles represent the means of the 2 subgroups.
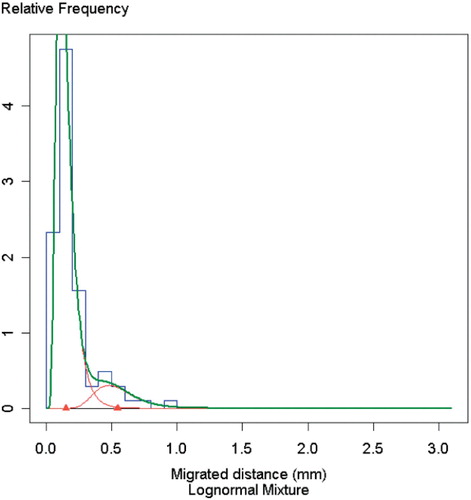
Figure 3. Frequency distribution along the x‐axis from 1 to 2 years. Blue lines indicate observations. Green and red lines indicate the estimated distributions under the assumption that the material consists of one or more groups with log‐normal distribution. Red triangles represent the means of the 2 subgroups.
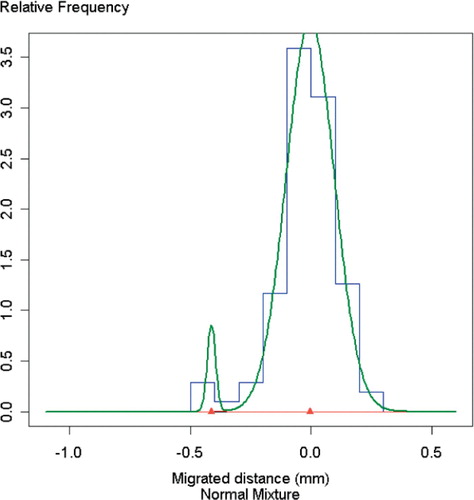
Figure 4. Frequency distribution along the y‐axis from 1 to 2 years. Blue lines indicate observations. Green and red lines indicate the estimated distributions under the assumption that the material consists of one or more groups with log‐normal distribution. Red triangles represent the means of the subgroups.
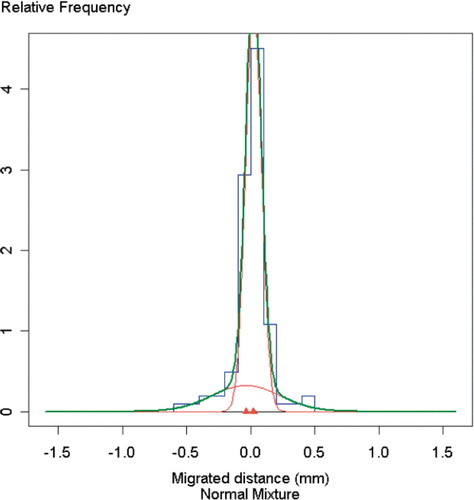
Figure 5. Frequency distribution along the z‐axis from 1 to 2 years. Blue lines indicate observations. Green and red lines indicate the estimated distributions under the assumption that the material consists of one or more groups with log‐normal distribution. Red triangles represent the means of the 2 subgroups.
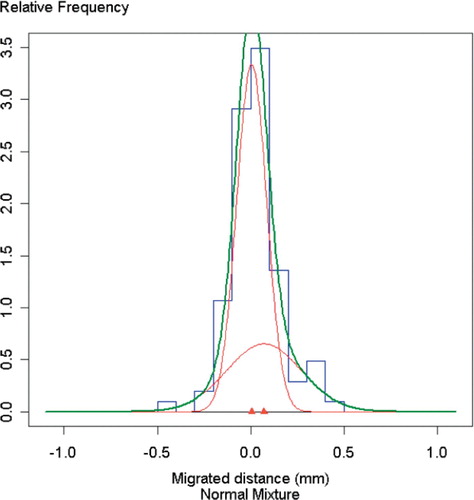
Table 3. Parameter estimates for mixture distributions. Component 1 corresponds to the distribution of the stable or less migrating population and component 2 to the distribution of the migrating population. The standard deviation for the estimate is given within parentheses
Table 4. AIC values considered in the modeling process