Figures & data
Table 1. General characteristics and diseases leading to shoulder replacement
Table 2. Prosthesis brands
Figure 1. Shoulder arthroplasties in 4 major diagnostic groups from 1994 through 2005. IA: inflammatory arthritis; OA: osteoarthritis.
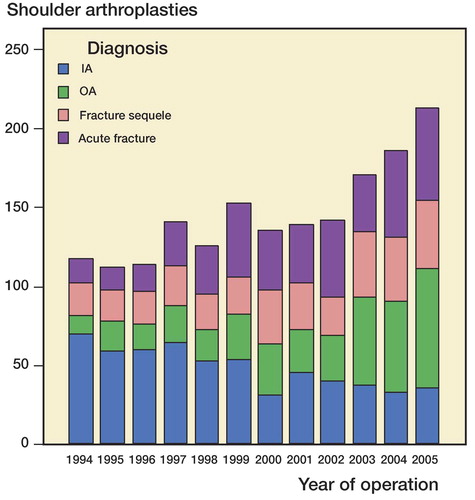
Table 3. Primary shoulder arthroplasties per annum. Overall incidence (per 100,000 inhabitants), total annual number, and annual number according to prosthesis type
Figure 2. Kaplan-Meier failure curve (with 95% CI shown in color) for all hemiprostheses, resurfacing hemiprostheses, reversed total shoulder replacement, and Neer-type total shoulder replacement.
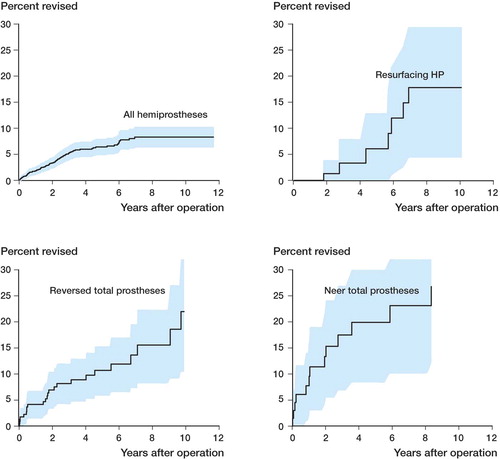
Figure 3. A. Kaplan-Meier failure curves for different hemiprosthesis brands. Groups with less than 20 patients were excluded. B. Kaplan-Meier failure curves according to shoulder disease.
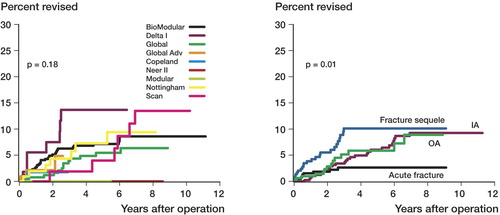
Table 4a. Cox regression analysis for revision after hemiarthroplasty, according to potential explanatory factors. 5- and 10-year failure rates estimated using the Kaplan-Meier method
Table 4b. Cox regression survival analysis for revision after reversed TSR, according to potential explanatory factors. 5- and 10-year failure rates estimated using the Kaplan-Meier method
Table 5. Causes of revision, according to type of prosthesis
Table 6a. Risk of revision due to specific causes, for hemiprostheses (HPs), according to shoulder disease and fixation. The results were obtained using an exact regression model
Table 6b. Risk of revision due to specific causes, after reversed TSR, according to shoulder disease and fixation. The results were obtained using an exact regression model