Figures & data
Figure 1. (a) Radiograph demonstrating a subtle periosteal reaction in the midshaft of the left tibia (arrowhead). (b) A coronal T1-weighted sequence showing loss of normal fatty marrow in the tibia. (c) A post-contrast fat-suppressed coronal T1-weighted image revealing contrast enhancement in the marrow and adjacent soft tissues. (d) Radiograph showing a periosteal reaction (arrowheads) and medullary sclerosis of the right tibia. (e) An axial T1-weighted image demonstrating reduced bone marrow signal of the right tibia with adjacent soft tissue intensity. (f) A post-contrast fat-suppressed axial T1-weighted image revealing contrast enhancement in the marrow and juxtacortical soft tissue enhancement in the right tibia.
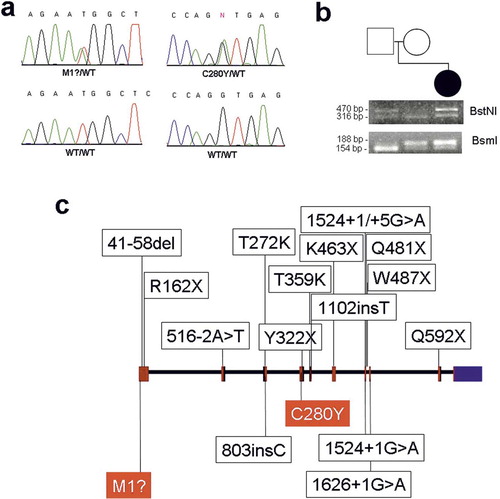
Figure 2. Mutation analysis. (a) Direct sequencing revealed a heterozygous T→A transversion at position 2 of the GALNT3 cDNA sequence (upper left panel) and a heterozygous G→A transition at position 839 of the GALNT3 cDNA sequence (upper right panel). The corresponding wild-type sequences are shown for comparision (lower panels). (b) To confirm mutations c.T2A and c.G839A, PCR-RFLP assays were performed. (c) GALNT3 mutations causing HFTC and HHS (respectively) are marked above and below a schematic representation of the GALNT3 gene (with the mutations identified in the present study shown in red).