Figures & data
Figure 1. Coronal micro-CT scan at 6 weeks. A. Low rigidity group (Ti-24Nb-4Zr-7.9Sn). B. High rigidity group (Ti-6Al-4V). The intramedullary devices have been removed for reduction of metal artifact.
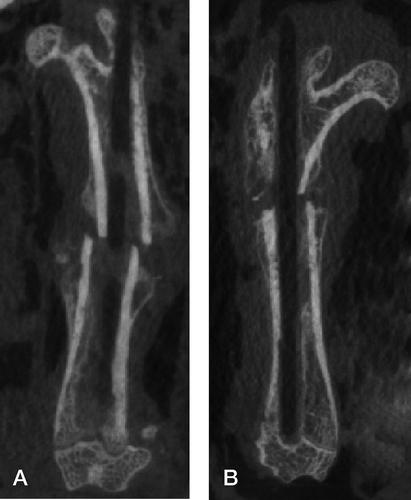
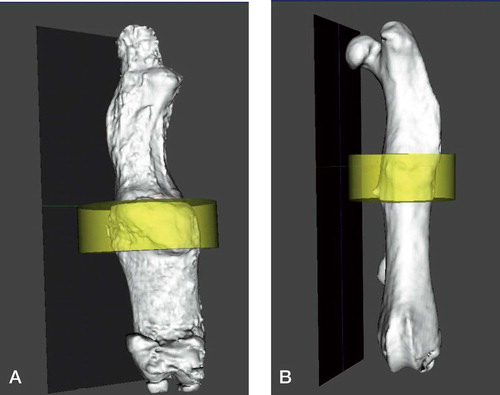
Figure 2. Three-dimensional reconstruction at 12 weeks (with yellow region corresponding to ROI1). A. Low-rigidity group. B- High-rigidity group.
Bone volume (BV) and total volume (TV) in 2 regions of interest (ROI1 and ROI2), and maximum load at 6 and 12 weeks. Values represent mean (SD)