
Figures & data
Figure 1. The radiograph shown in the survey; the same for all 5 patient descriptions.
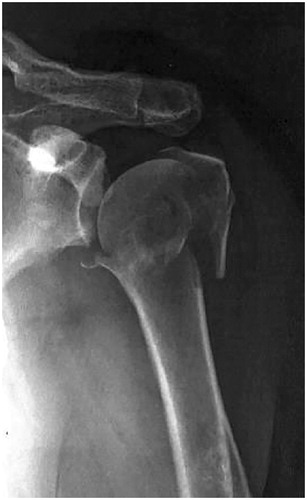
Table 1. Treatment choices of the 354 surgeons included in the final analysis. The cases are presented in order of age. In the survey, the order was different
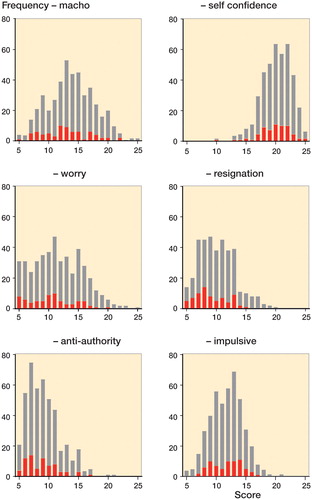
Figure 2. Distribution of hazardous attitudes. Possible values range from 5 (lowest Likert score for all questions) to 25 (highest score for all questions). Number of respondents who recommended nonoperative treatment for all cases is shown in red.
Supplemental material