Figures & data
Figure 1. Annual incidence of shoulder arthroplasty procedures per 105 inhabitants from 7 countries with a national registry.
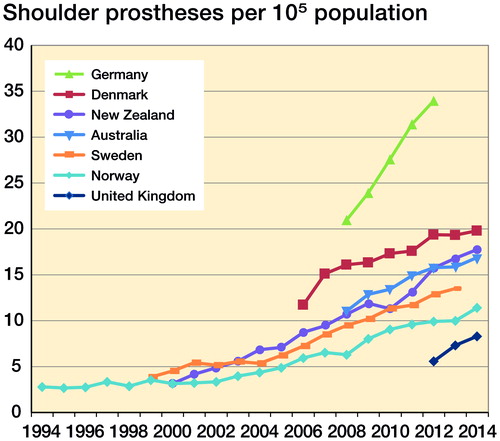
Table 1. Registries included
Table 2. Incidence rates of shoulder prostheses in 2012 in the 7 countries with available national data
Table 3. Distribution of indications by country/region. Values are number (%)
Figure 2. Distribution of the 3 main shoulder arthroplasty procedures performed by country for the years 2000, 2006, and 2014. 2000: Denmark data from 2004; Norway data for 1994–2005. 2006: Australia and Germany data from 2008. 2014: Germany data from 2012; Sweden data from 2013.
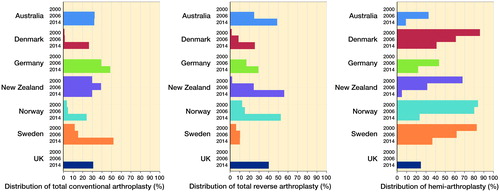
Table 4. Distribution of types of procedures by country/region. Values are number (%)
Figure 3. Distributions of implant choice across 5 disease indications by country/region.
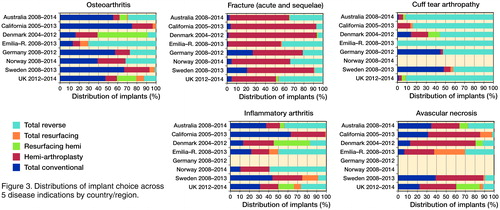
Figure 4. Forest plot illustrating between-registry variation in proportion of total conventional arthroplasty in patients with osteoarthritis.
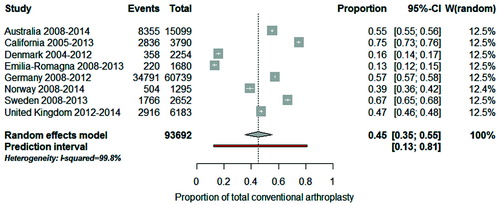
Figure 5. Forest plot illustrating between-registry variation in proportion of total reverse arthroplasty in patients with cuff tear arthropathy.
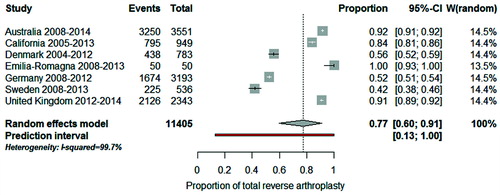
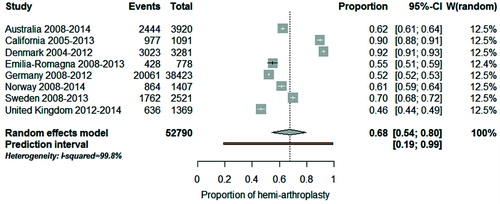
Figure 6. Forest plot illustrating between-registry variation in proportion of hemi-arthroplasty in patients with fracture.