Figures & data
Figure 1. CONSORT flow diagram. TKA = total knee arthroplasty.
a Missed follow-up; b Technical reasons, clinical follow-up only.
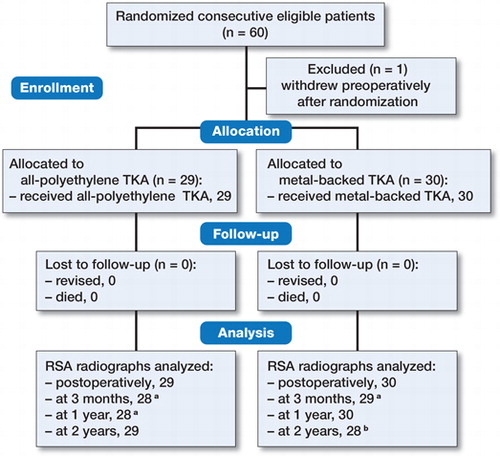
Table 1. Baseline demographic characteristics
Table 2. RSA migration analysis of mean maximum total point motion (logMTPM values are back-transformed in original scale in millimeters), as provided by the mixed-effects model
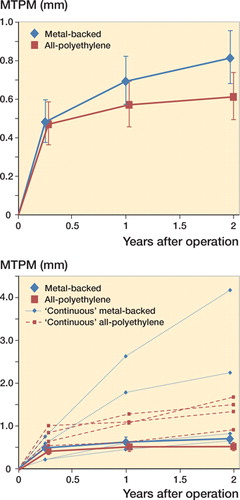
Figure 2. RSA analysis results of maximum total point motion (MTPM). Top: mean and 95% confidence interval for the groups; bottom: mean and 95% confidence interval for the same groups excluding 8 individual components showing continuous migration of >0.2 mm in the second postoperative year. These individual components are illustrated as 4 dashed blue lines (metal-backed) and 4 dashed red lines (all-polyethylene).