
Figures & data
Figure 1. Flowchart of patients with idiopathic clubfoot.
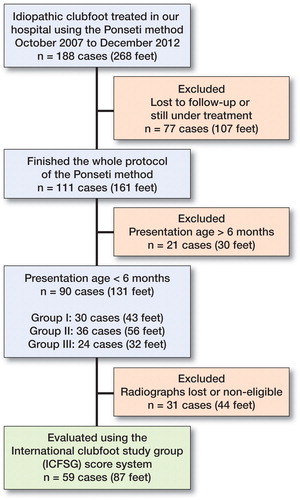
Figure 2. Foot-abduction brace was applied in our clinics. The brace consists of a bar with the shoes attached at 60–70° of abduction on the affected side and 30–40° on the normal side.
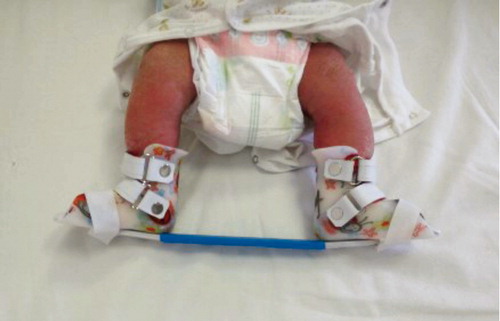
Figure 3. Relapse was identified at 4 years of age for poor brace compliance. Right clubfoot: Dimeglio score =8. (A) Forefoot adductus, (B) No obvious varus deformity, (C) Lateral edge curve, (D) Equinus deformity, (E) Standing anteroposterior views: reduced talocalcaneal angle, (F) Standing lateral views: reduced talocalcaneal angle and flat-top talus.
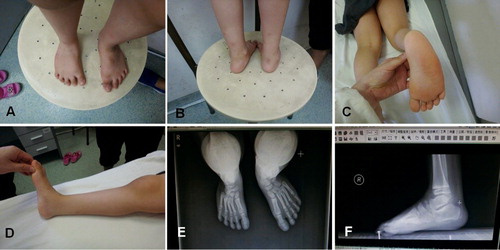
Figure 4. The same patient after repeated Ponseti treatment: ICFSG =4. (A–C) Morphology evaluation =1, (D) Muscle function =0, (E) Radiologic evaluation =3, (F) Gait analysis: dynamic function =0.
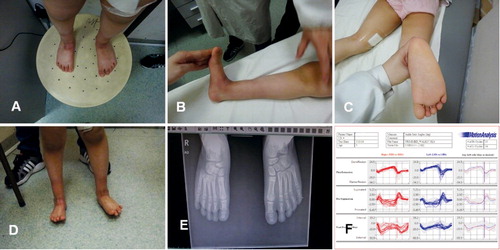
Table 1. Demographic data with reference to age when clubfoot management was initiated
Table 2. Linear regression of ICFSG score with clinical characteristics (n = 59)
Table 3. Demographic data after propensity score matching