
Figures & data
Table 1. Distribution of TARs implanted in Sweden during 1993–2016 by year of implantation and prosthetic design
Table 2. Data on distribution of diagnoses, sex and age per prosthetic design group
Table 3a. Information on reasons for revision for early prosthetic designs
Figure 1. Estimated cumulative prosthetic survival for all 1,226 TARs. Number of patients still at risk of experiencing the primary endpoint and prosthetic survival with 95% CI per 5-year period are indicated in the life table
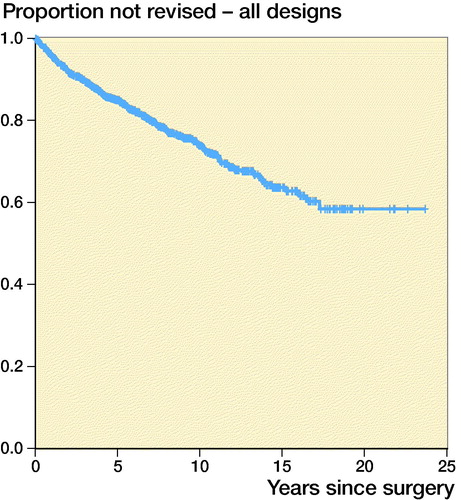
Figure 2. Estimated cumulative prosthetic survival for early and current designs. Number of patients still at risk of experiencing the primary endpoint and prosthetic survival with 95% CI per 5-year period are indicated in the life table
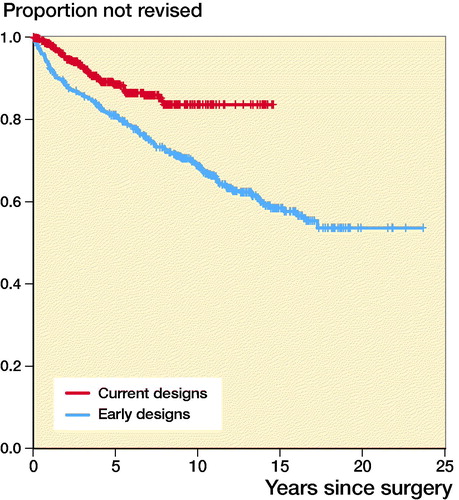
Figure 3. Estimated cumulative prosthetic survival for early designs. Number of patients still at risk of experiencing the primary endpoint and prosthetic survival with 95% CI per 5-year period are indicated in the life table.
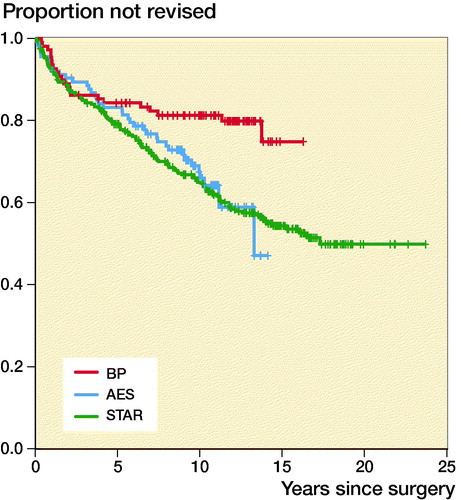
Figure 4. Estimated cumulative prosthetic survival for current designs. Number of patients still at risk of experiencing the primary endpoint and prosthetic survival with 95% CI per 5-year period are indicated in the life table.
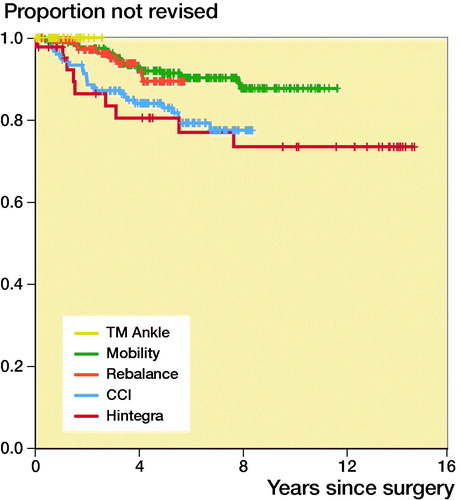
Table 3b. Information on reasons for revision for current prosthetic designs