
Figures & data
Figure 1. Number of hemiarthroplasties (SHA) and reverse shoulder arthroplasties (RTSA) due to failed nonoperative treatment of proximal humerus fracture registered in the Danish Shoulder Arthroplasty Registry, 2006–2015.
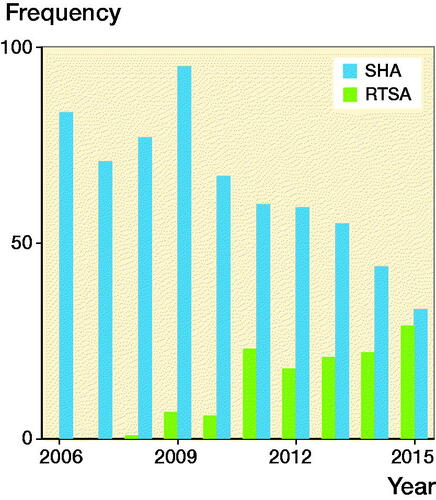
Table 1. Demographics of the study population presented by other type of arthroplasties (Others), stemmed hemiarthroplasty (SHA), and reverse shoulder arthroplasty (RTSA). Values are n (%) unless otherwise specified
Figure 2. Cumulative survival for all types of arthroplasties, 2006–2015
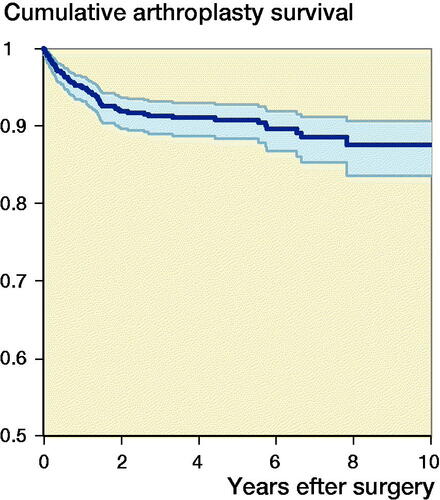
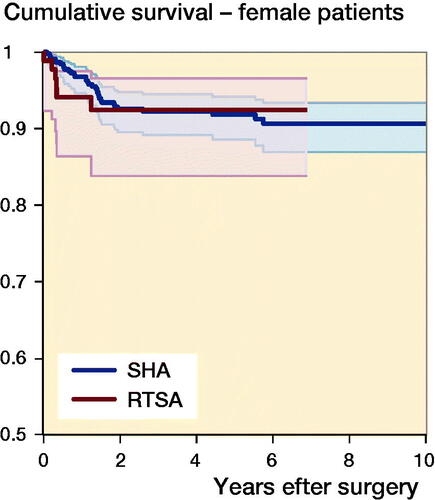

Table 2. Univariate and multivariate Cox regression model for revision of stemmed hemiarthroplasty (SHA), reverse shoulder arthroplasty (RTSA), sex, age, and period of surgery, (n = 771, revisions = 62)
Table 3. Multivariate Cox regression model for revision of women (n = 551, revisions = 40) and men (n = 220, revisions = 22) adjusted for age and period of surgery
Table 4. Reasons for revision for all types of arthroplasties (All), other types of arthroplasties (Others), stemmed hemiarthroplasty (SHA), and reverse shoulder arthroplasty (RTSA). Values are n, (percentage of primary arthroplasties), and percentage of revisions
Figure 4. Distribution of WOOS scores at the 1-year follow-up for all patients.
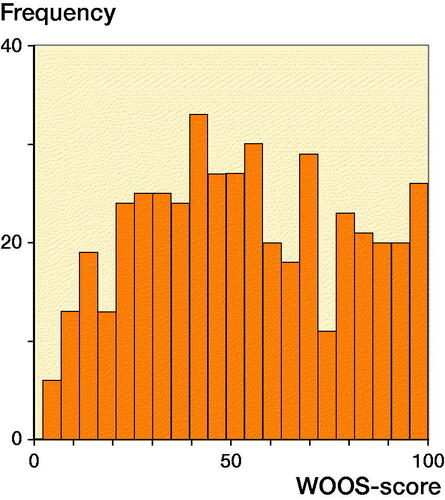
Table 5. Univariate and multivariate linear regression model for mean difference (MD) in Western Ontario Osteoarthritis of the Shoulder score, type of arthroplasty, sex, age, and period of surgery, (n = 417)
Table 6. Comparison of patients responding or not responding to the Western Ontario Osteoarthritis of the Shoulder index (WOOS). Values are n (%) unless otherwise specified