Figures & data
Table 1. Demographics and surgical data on THR operations 2011–2015 in patients with osteoarthritis and complete PROM data. Values are n (%) unless otherwise specified
Table 2. Mean values (SD) and change (Delta (SD)) in PROs in THRs with complete data preoperatively and 1 year postoperatively
Table 4. Categories of satisfaction with the THR operation. Values are n (%)
Figure 1. Flow chart of the study. THR = total hip replacement, TKR = total knee replacement, and OA = osteoarthritis.
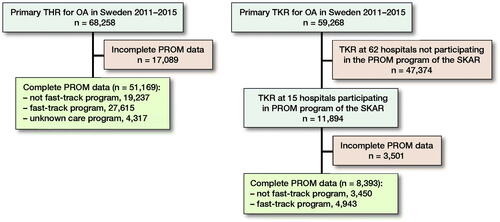
Figure 2. Multivariable regression analysis of PROs 1 year after THR/TKR with 95% CI. Regression coefficients for fast-track (not fast-track reference). Adjustments for age, sex, BMI, Charnley class, preop scores, and year of operation. For THR also adjustment for implant fixation method and surgical approach.
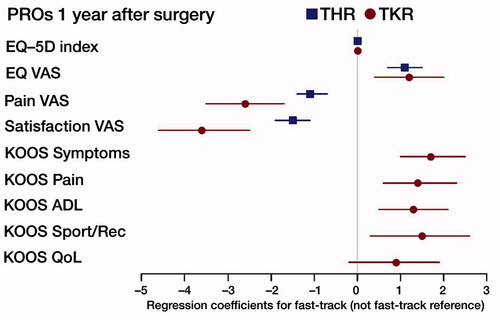
Table 5. Demographics and surgical data on TKR operations 2011–2015 in patients with osteoarthritis and complete PROM data. Values are n (%) unless otherwise specified
Table 6. Mean values (SD) and change (Delta (SD)) in PROs in TKRs with complete data preop and 1 year postoperatively
Table 7. EQ-5D3L data in TKR patients with complete responses preoperatively and 1 year postoperatively. Values are n (%)
Table 8. Categories of satisfaction with the TKR operation. Values are n (%)
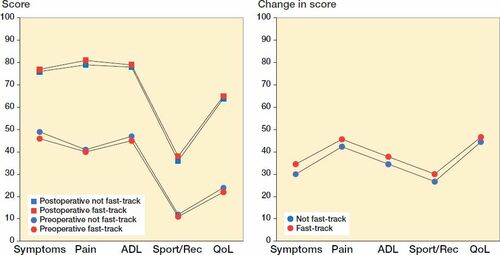
Figure 3. Mean scores (left panel) and improvement (right panel) of the KOOS subscales (0–100) preoperatively and 1-year postoperatively.