
Figures & data
Figure 1. The center of the tibial plateau was determined by drawing a circle within the medial and lateral cortex. A second circle fit inside the distal tibia between the medial and lateral cortex and touched the plafond distally. The mechanical axis goes through both the center of the distal tibia and the center of the talus. A line marking the tibial plateau/distal tibial component intersected the mechanical axis for the medial distal tibial (MDTA; small arch) angle. The medial talus (large arch) angle was measured from a transecting line, tracing the superior talus/talar component. An angle above 90° is a valgus angle and below 90° is a varus angle.
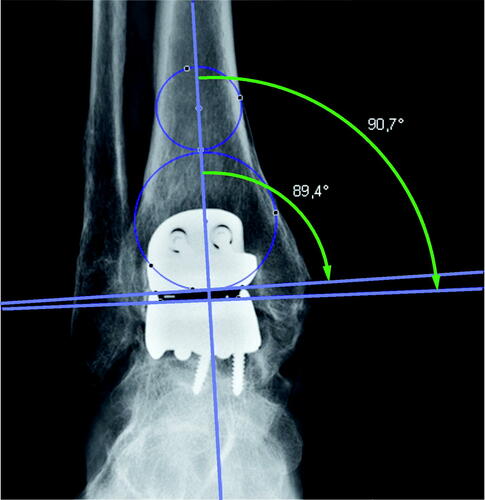
Figure 2. Markings to calculate the anterior distal tibial angle tibial plateau/distal tibial component (ADTA; green arch). For tibial axis, see .
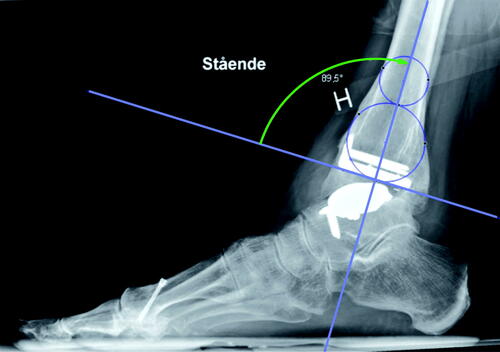
Figure 3. Flow chart.
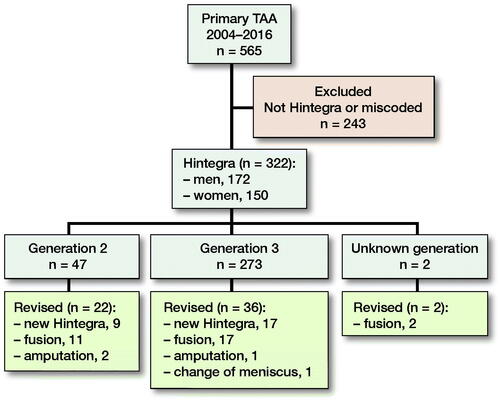
Table 1. 322 total ankle arthroplasties (TTAs) distributed among 8 different surgeons and subsequent revision surgeries, 13 unknowns
Figure 4. Kaplan–Meier plot of the survival rates of generation 2 and generation 3.
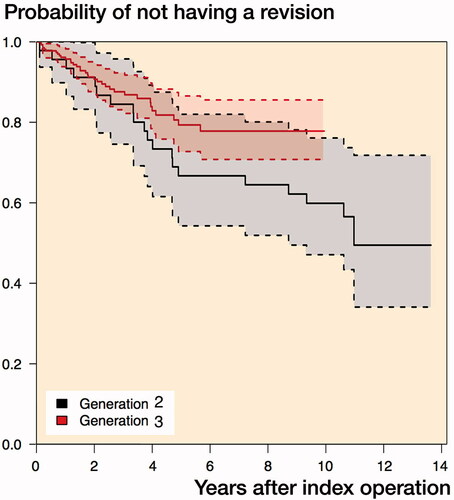
Table 2. The Cox proportional hazard multivariate analysis of risk for revision