
Figures & data
Table 1. Evaluation metrics
Table 2. A 2-by-2 confusion table for a binary test—2 possible outcomes
Figure 1. Confusion matrix for an ankle fracture classification experiment, according to Danis-Weber (AO Foundation/Orthopedic Trauma Association (AO/OTA)) classification. There are 26 type A fractures, 137 type B fractures, and 47 type C fractures. Data reproduced from (Olczak et al. 2020).
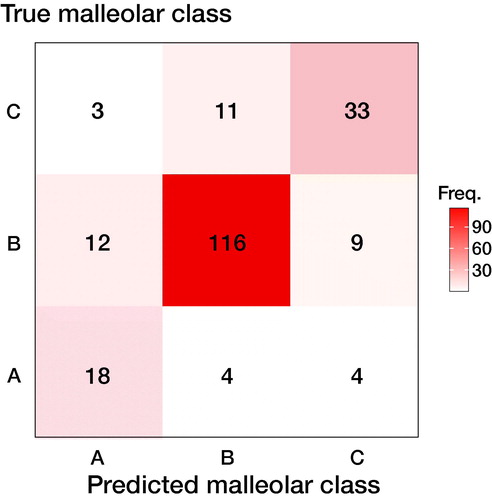
Table 3. Dividing the 3-by-3 confusion matrix from into 3 binary submatrices
Figure 2. Graphical illustration of precision and sensitivity (or recall). Circles, “●,” represent cases without the disease/class. Bullets, “●,” represent cases with the disease/class.
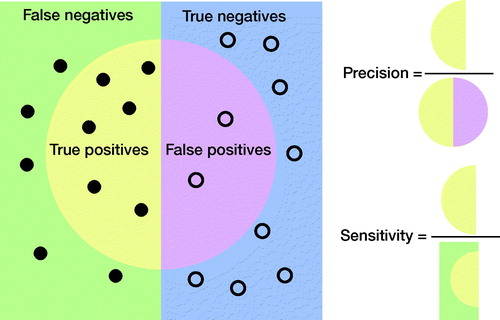
Figure 3. ROC and PR curves for malleolar class predictions. The ROC curves (left) are monotonically growing functions of sensitivity (y-axis) and the FPR (x-axis). The AUC of the ROC curve corresponds to overall model accuracy. The PR-curves (right) have precision on the y-axis and sensitivity on the x-axis. Unlike the ROC, we see that it can oscillate and tends towards zero. The differences between the outcomes are also greater.
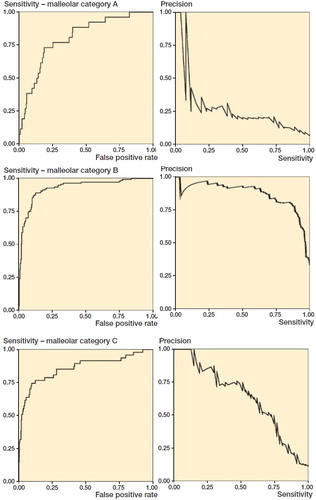
Figure 4. Comparing the IoU and the F1 score in terms of data overlap. The overlapping sets illustrate why both are commonly used performance measures in object detection and image segmentation. The IoU is the percentage of area overlap of correct detection. The F1-score is the “harmonic mean” where the TPs are given additional importance. We can transform one into the other (see supplement). See for how to compute IoU and F1 score.
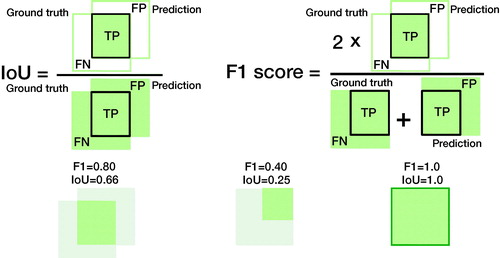
Figure 5. Recommendations for choosing outcome metrics suitable for clinicians. The selected measures are selected for their (1) suitability and (2) their interpretability to a clinician. Deviations from these are possible; however, they need to be motivated, and we recommend also reporting these metrics. IoU (Intersection over Union); ROI (Region of Interest); MAE (Mean Average Error); RMSE (Root Mean Squared Error); AUC (Area Under the Receiver Operating Characteristic curve; AUPR (Area Under the Precision-Recall curve).
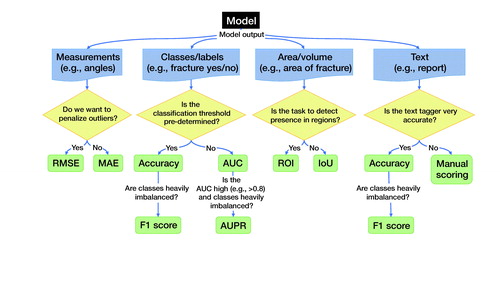
Table 4. Clinical AI Research (CAIR) Checklist Proposal
Table 5. Example sentences for medical text analysis using BLEU and ROUGE