
Figures & data
Figure 1. (A) Decision trees are hierarchical structures in which each node performs a test on the input value with the subsequent branches representing the outcomes. Their graphical representation as seen here makes them easy to understand and interpret. However, they are prone to overfitting. (B) Neural networks are based on interconnected nodes. The input features are represented by the first (blue) layer. The designated outcome is represented by the final (green) layer. The middle, hidden layers (blue and orange) base their output on the input they get from prior layers. Neural networks have been around for a long time and offer good discriminative abilities, but interpretation of the relationships between the different layers remains difficult. (C) Support vector machines (SVMs) perform classification by determining the optimal separating hyperplane between datapoints, which maximizes the distance between the 2 closest points of either group. They can be used for both linear and nonlinear relationships. While they remain effective in data with a great number of features, they do not work well in larger datasets.
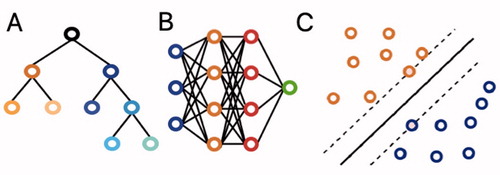
Figure 2. Flowchart of study inclusions and exclusions.
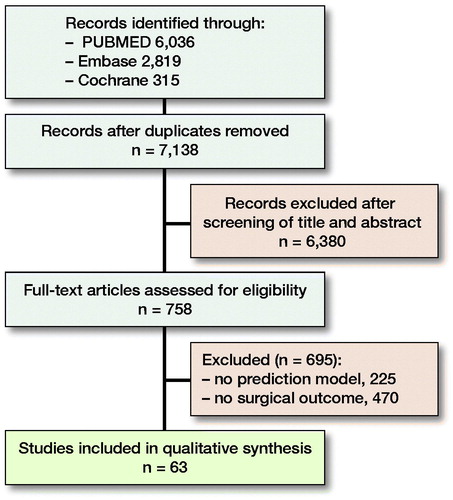
Table 1. Data extracted from each study
Table 3. Characteristics of studies (n = 77). Values are count (%) unless otherwise specified
Table 2. Studies evaluating ML models for orthopedic surgical outcome prediction