Figures & data
Figure 2. Flowchart of total hip arthroplasty (THA) cohort.
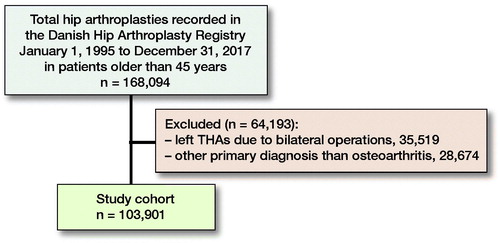
Figure 3. Demographics with distribution of sex, age and Charlson comorbidity index score in the 4 SES markers. Sex and Charlson comorbity index score distribution is given in percent on the x-axis. Age distribution is shown with age on the x-axis, green line is median age and white lines marks the first and third quartile.
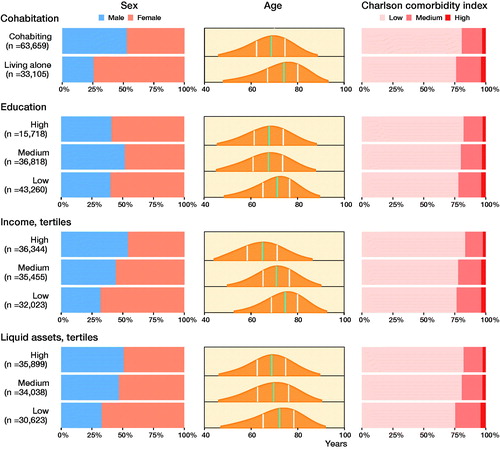
Figure 4. Cumulative incidence of any revision for the 4 SES markers.
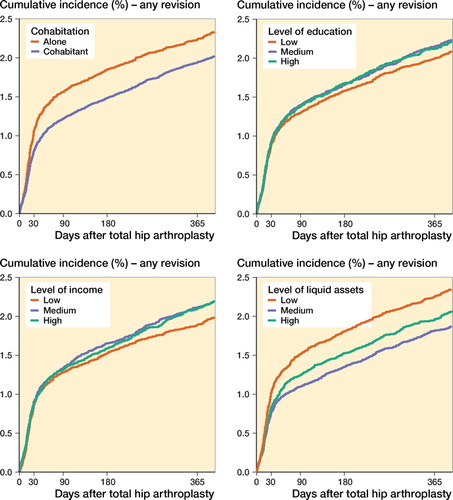
Figure 7. Hazard ratios for revision due to any cause, infection, fracture, and dislocation at 90 days. Hazard ratios are adjusted for age, sex, calendar year, and CCI. Income and liquid assets were also adjusted for cohabiting status.
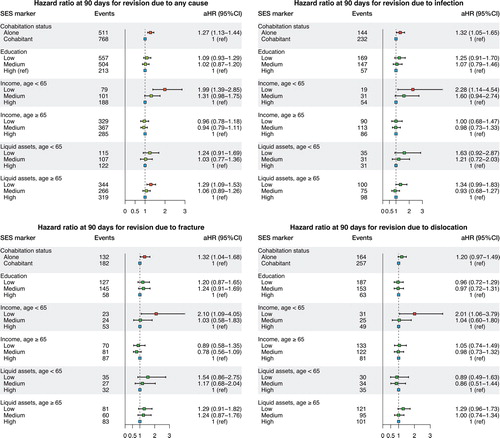
Figure 9. Cumulative incidence of mortality for the 4 SES markers.
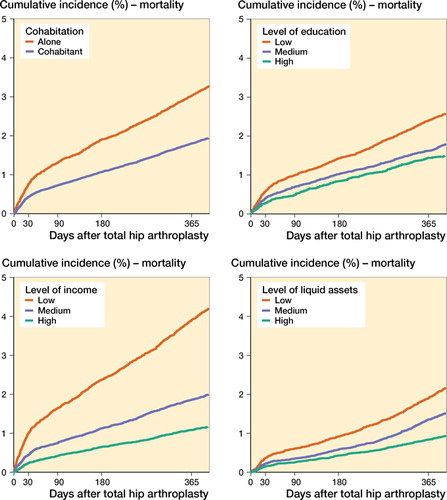
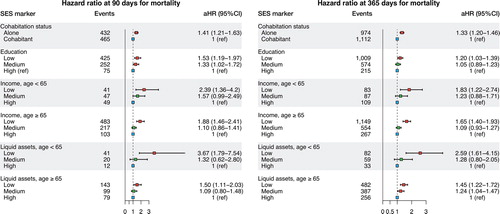
Figure 10. Hazard ratios of mortality for the 4 SES markers. Hazard ratios are adjusted for age, sex, calendar year, and CCI. Income and liquid assets were also adjusted for cohabiting status.