Figures & data
Table 1. General objective criteria for the five diagnostic groups
Table 2. Elective surgical procedures performed
Figure 3. Preoperative pain graded on the VAS scale regarding back pain (means and 95% CI) related to diagnosis. Abbreviations: See page 3.
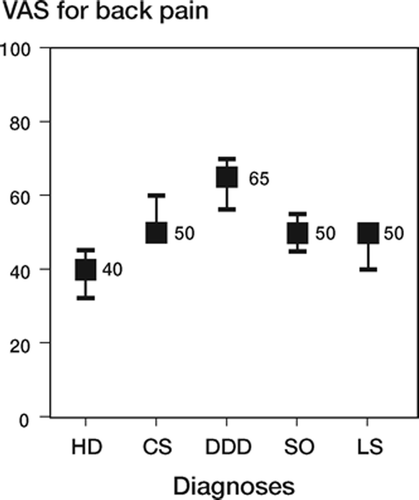
Figure 4. Preoperative pain graded on the VAS scale regarding leg pain (means and 95% CI) related to diagnosis.
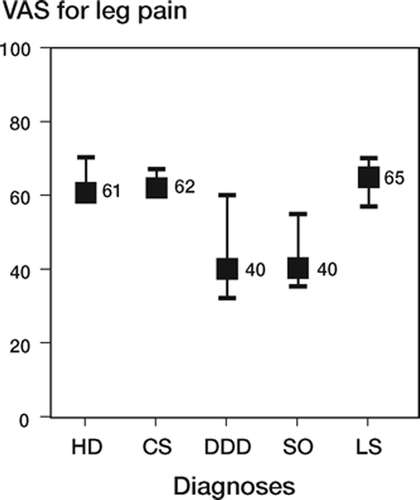
Table 3. Patient satisfaction vs. other pain outcomes. The self graded patient satisfaction 12 months after surgery has been tested regarding correlation to other types of pain outcomes
Table 4. Characteristics of study population
Figure 5. SF-36 profiles for the 5 diagnostic categories (bars) compared with normative values for the Swedish normal and sciatica population (lines). Abbreviations, see page 3.
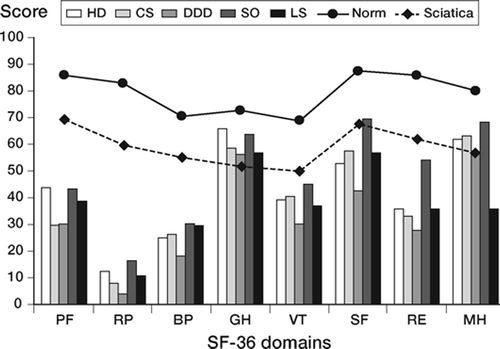
Figure 6. Mean deviations from the norms of the Swedish general population on the eight SF-36 scales for the five diagnostic subgroups, Preoperatively.
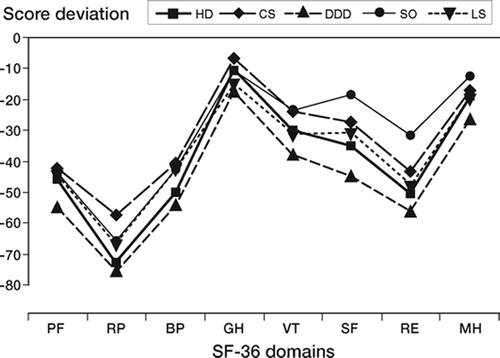
Figure 7. Mean values (with 95% CI) of the PF, BP, SF domain and median age for the 5 diagnostic categories.
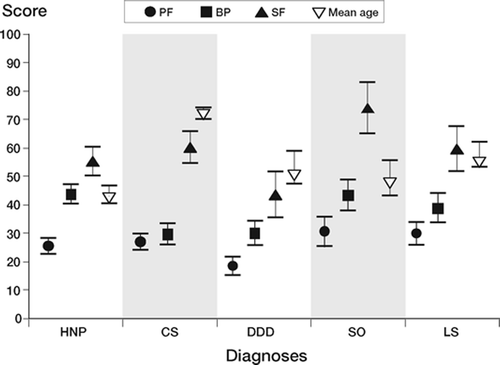
Figure 8. Mean deviations from the norms of the Swedish general population on the eight SF-36 scales for the five diagnostic subgroups, postoperatively. Abbreviations, see page 3.
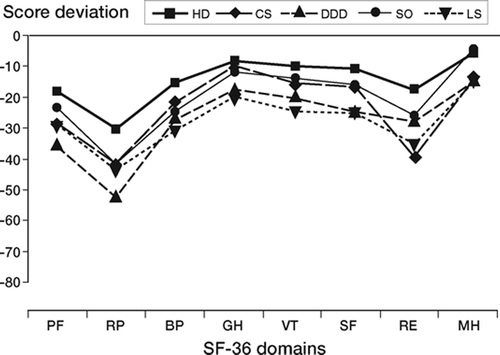
Figure 9. Mean deviations from the norms of the Swedish general population on the 8 SF-36 scales for the two identified clusters, Preoperatively. * indicates a significant (Mann-Whitney, p<0.01) difference between the two clusters.
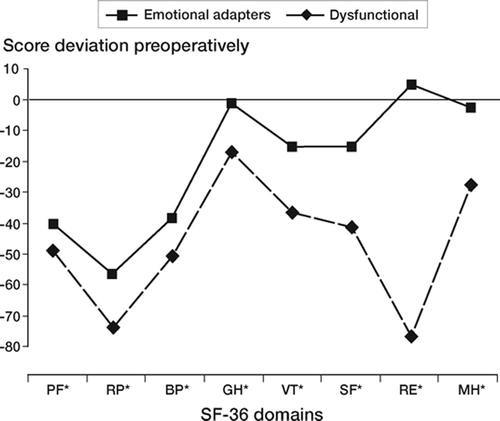
Figure 10. Mean deviations from the norms of the Swedish general population on the 8 SF-36 scales for the two identified clusters, postoperatively. * indicates a significant (Mann-Whitney, p<0.01) difference between the two clusters.
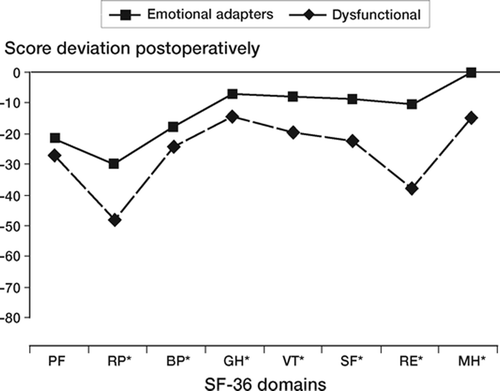
Figure 11. Preoperative SF-36 profiles (mean and 95% CI) for the D- and the X-group compared with normative values for the Swedish and US population. * indicates a significant (Mann-Whitney, p < 0.01) difference between Dand X-group.
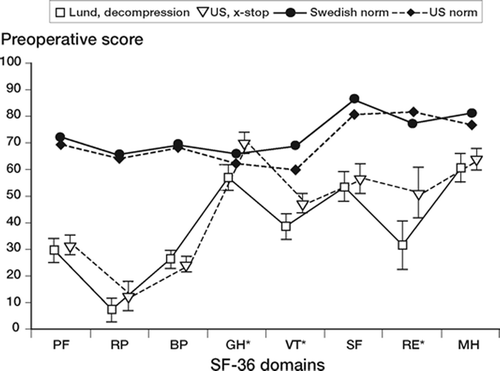
Figure 12. Postoperative SF-36 profiles (mean and 95% CI) for the D- and the X-group compared with normative values for the Swedish and US population. * indicates a significant (Mann-Whitney, p<0.01) difference between D- and X-group.
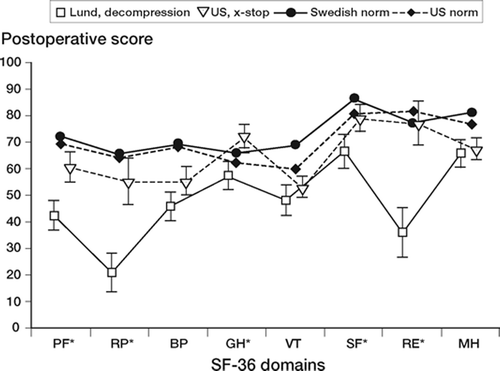
Table 5. Distribution of patients in the five diagnostic groups in percentage
Table 6. Elective surgical procedures performed in percentage
Table 7. Mean SF-36 scores for the whole sample
Table 8. Mean SF-36 scores for persons who underwent elective lumbar spine surgery for lumbar disc herniation
Table 9. Mean SF-36 scores for persons who underwent elective lumbar spine surgery for central stenosis
Table 10. Mean SF-36 scores for persons who underwent elective lumbar spine surgery for degenerative disc disease
Table 11. Mean SF-36 scores for persons who underwent elective lumbar spine surgery for spondylolisthesis
Table 12. Mean SF-36 scores for persons who underwent elective lumbar spine surgery for lateral stenosis
Table 13. Responsiveness statistics. their formulas. and relevant differential values and measures of variability used in the calculation of pain and functional outcomes
Table 14. Intra–class Correlation Coefficients for the outcome variables in the two samples
Table 15. Agreement (weighted kappa) for the outcome variables in the two samples
Table 16. Differential values for several pain outcomes categorised by patients' rating of postoperative pain improvement. Values are mean (95% CI)
Table 17. Differential values for several pain and functional outcomes categorised by patients' rating of postoperative improvement. Values are mean (95% CI)
Table 18. Crosstabulation between pain outcomes categorised by patients' rating of postoperative improvement and mean score improvement across the five main diagnostic subgroups. Values are median
Figure 13. Girolamo Fabritio d'Aqvapendente (1533–1619) L'opere cirughiche. Padua 1671 Second part: On surgical operations, Prologue p. 189
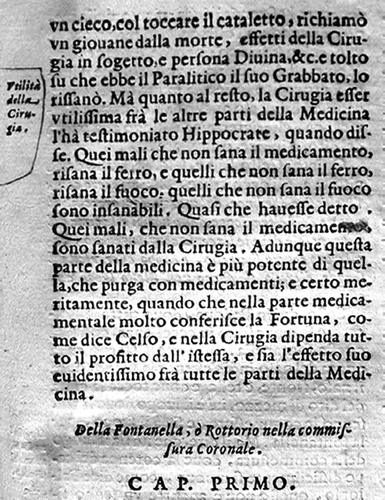
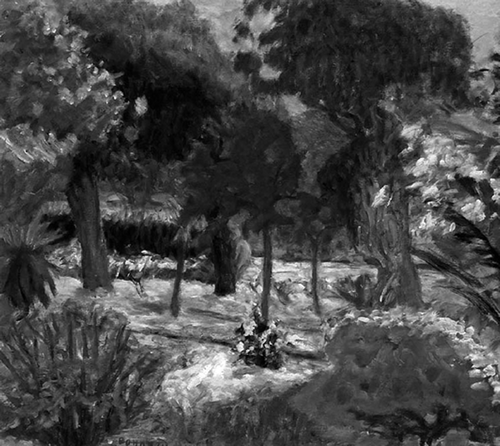
Figure 14. Pierre Bonnard (1867–1947), Le Jardin dans le Var (Garden in Southern France, Var) 1914, oil on canvas 51.0 (h) x 57.0 (w) cm. Villa Flora, Winterthur.
