2,801
Views
32
CrossRef citations to date
0
Altmetric
Original Articles

Comparative cytotoxicity evaluation of different size gold nanoparticles in human dermal fibroblasts

, , &
Pages 1401-1417 | Received 23 Jul 2014, Accepted 30 Jan 2015, Published online: 27 Feb 2015

Figures & data

Table 1. Size distribution of AuNPs measured by TEM and DLS.

Figure 1. Analysis of 30 (1), 50 (2) and 90 (3) nm gold nanoparticles size by TEM and DLS. Representative TEM images (A) and size distribution by DLS (B) after 24 h incubation in cell-free culture medium. Scale bars represent 100 nm (1A and 3A) and 200 nm (2A).
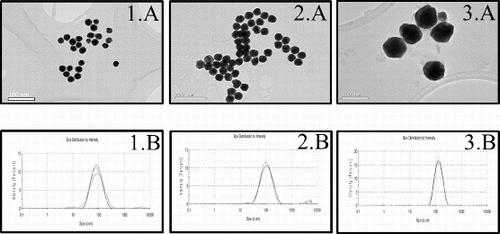
Figure 1. Analysis of 30 (1), 50 (2) and 90 (3) nm gold nanoparticles size by TEM and DLS. Representative TEM images (A) and size distribution by DLS (B) after 24 h incubation in cell-free culture medium. Scale bars represent 100 nm (1A and 3A) and 200 nm (2A).

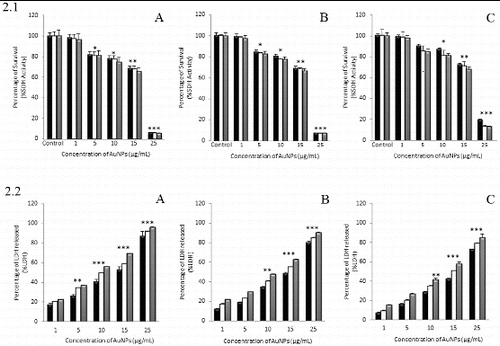
Figure 2. Effect of 30 nm (A), 50 nm (B) and 90 nm (C) AuNPs on NHDF cell viability by MTT (2.1) and LDH (2.2) assays. Cells were cultured with different concentrations of AuNPs for 24 (▪), 48 (□) and 72 h (

). Control, untreated cells. Asterisks indicate significant difference from control *** p ≤ 0.001, ** p ≤ 0.01 and * p ≤ 0.05.

Figure 2. Effect of 30 nm (A), 50 nm (B) and 90 nm (C) AuNPs on NHDF cell viability by MTT (2.1) and LDH (2.2) assays. Cells were cultured with different concentrations of AuNPs for 24 (▪), 48 (□) and 72 h (Display full size). Control, untreated cells. Asterisks indicate significant difference from control *** p ≤ 0.001, ** p ≤ 0.01 and * p ≤ 0.05.

Table 2. Calculated IC50 values in NHDF cell line determined by MTT and LDH.

Figure 3. Effect of NAC on NHDF cell viability after the treatment with AuNPs. Cells were treated with IC50 for 24 h. Control, untreated cells.
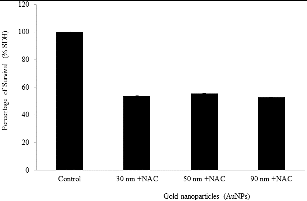
Figure 3. Effect of NAC on NHDF cell viability after the treatment with AuNPs. Cells were treated with IC50 for 24 h. Control, untreated cells.

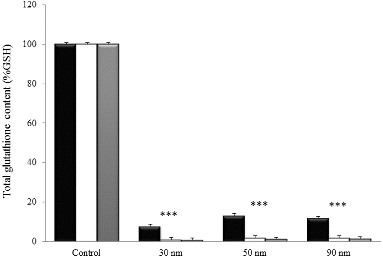
Figure 4. Effect of AuNPs on the total glutathione content in NHDF cells. Cells were treated with the IC50 for 24 (▪), 48 (□) and 72 h (

). Control, untreated cells. Asterisks indicate significant difference from control *** p ≤ 0.001.

Figure 4. Effect of AuNPs on the total glutathione content in NHDF cells. Cells were treated with the IC50 for 24 (▪), 48 (□) and 72 h (Display full size). Control, untreated cells. Asterisks indicate significant difference from control *** p ≤ 0.001.

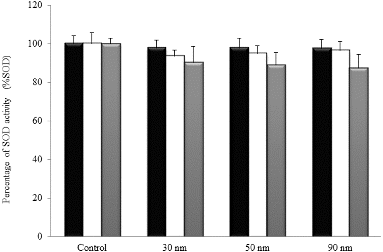
Figure 5. Effect of AuNPs on the SOD activity in NHDF cells. Cells were treated with the IC50 for 24 (▪), 48 (□) and 72 h (

). Control, untreated cells.

Figure 5. Effect of AuNPs on the SOD activity in NHDF cells. Cells were treated with the IC50 for 24 (▪), 48 (□) and 72 h (Display full size). Control, untreated cells.

Figure 6. Time course of ROS production in NHDF cells, untreated (○) and treated with the IC50 AuNPs of 30 nm (•), 50 nm (▪) and 90 nm (▴). Asterisks indicate significant difference from control *** p ≤ 0.001.
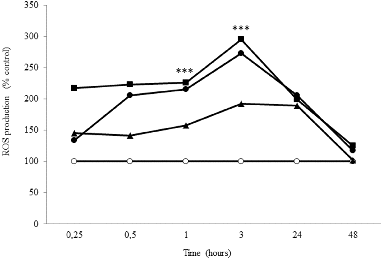
Figure 6. Time course of ROS production in NHDF cells, untreated (○) and treated with the IC50 AuNPs of 30 nm (•), 50 nm (▪) and 90 nm (▴). Asterisks indicate significant difference from control *** p ≤ 0.001.

Reprints and Corporate Permissions

Please note: Selecting permissions does not provide access to the full text of the article, please see our help page How do I view content?

To request a reprint or corporate permissions for this article, please click on the relevant link below:

Academic Permissions

Please note: Selecting permissions does not provide access to the full text of the article, please see our help page How do I view content?

Obtain permissions instantly via Rightslink by clicking on the button below:

If you are unable to obtain permissions via Rightslink, please complete and submit this Permissions form. For more information, please visit our Permissions help page.