889
Views
20
CrossRef citations to date
0
Altmetric
Original Articles

Ultrafine titanium dioxide nanoparticles induce cell death in human bronchial epithelial cells

, , , &
Pages 171-183 | Received 31 Mar 2008, Accepted 15 Aug 2008, Published online: 27 Sep 2008

Figures & data

Figure 1. Relative cell viability of Chago-K1 cells monitored by CCK-8 assay following 24 h exposure to various TiO2 concentrations. Data are shown as percentages of viability in comparison with untreated control and presented as mean ± SD of three separate experiments. Treated groups are significantly different from the untreated control at p < 0.005 as indicated by ‘**’.
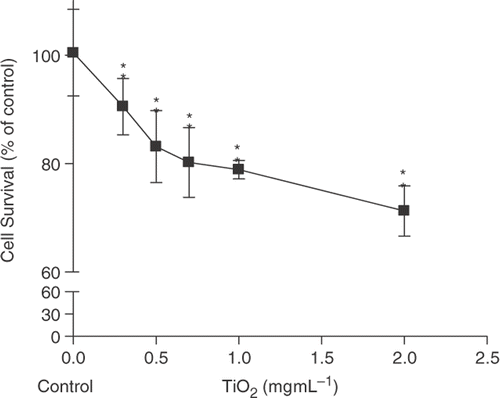
Figure 1. Relative cell viability of Chago-K1 cells monitored by CCK-8 assay following 24 h exposure to various TiO2 concentrations. Data are shown as percentages of viability in comparison with untreated control and presented as mean ± SD of three separate experiments. Treated groups are significantly different from the untreated control at p < 0.005 as indicated by ‘**’.
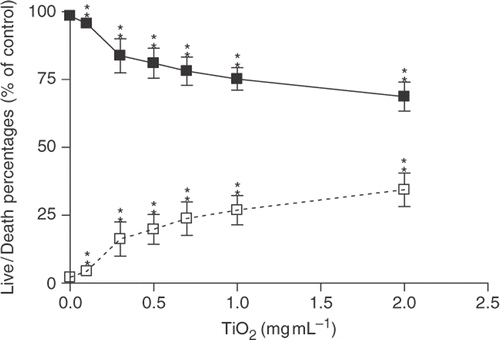
Figure 2. Percentages of cell alive/dead (Chago-K1 cells) detected using Live/Dead assay kit following exposure to various concentrations of TiO2 for 24 h. Solid squares symbolise the percentages of live cells while the open squares correspond to the percentages of dead cells. Data are presented as Live/Dead percentages of the untreated control and displayed as mean±SD of three separate experiments. Treated groups are significantly different from the untreated control at p < 0.005 as indicated by ‘**’.

Figure 2. Percentages of cell alive/dead (Chago-K1 cells) detected using Live/Dead assay kit following exposure to various concentrations of TiO2 for 24 h. Solid squares symbolise the percentages of live cells while the open squares correspond to the percentages of dead cells. Data are presented as Live/Dead percentages of the untreated control and displayed as mean±SD of three separate experiments. Treated groups are significantly different from the untreated control at p < 0.005 as indicated by ‘**’.

Figure 3. Percentages of chromatin condensation detected by Hoechst dye staining following exposure to different TiO2 concentrations for 24 h. Data are presented as percentages of chromatin condensation in comparison with the untreated control and displayed as mean±SD of three separate experiments. Treated groups are significantly different from untreated control at p < 0.005 as indicated by ‘**’.
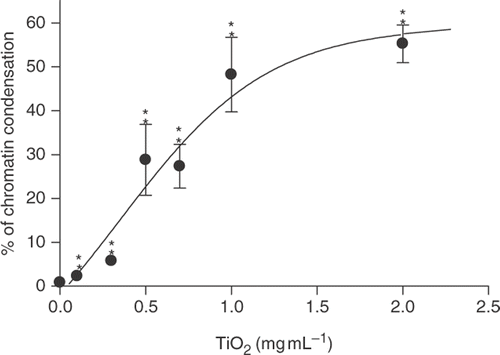
Figure 3. Percentages of chromatin condensation detected by Hoechst dye staining following exposure to different TiO2 concentrations for 24 h. Data are presented as percentages of chromatin condensation in comparison with the untreated control and displayed as mean±SD of three separate experiments. Treated groups are significantly different from untreated control at p < 0.005 as indicated by ‘**’.

Figure 4. Images of fluorescent staining of Annexin V, Hoechst and overlay in Chago-K1 cells following 24 h treatment of different TiO2 concentrations. Cell nuclei were stained light blue by Hoechst dye in the untreated control group but appeared rounded and brightly fluorescent in the treated groups. The green Annexin V staining clearly labelled cell membrane confirming translocation of phosphatidylserine from the inner to outer leaflet of cell membrane. (a)–(c) Treatment of 1 mg mL−1 TiO2 in Chago-K1 cells. (d)–(e) Treatment of 0.3 mg mL−1 TiO2 also revealed significant increase in Annexin V and Hoechst staining compared to the control (no nanoparticles) (g)–(i).
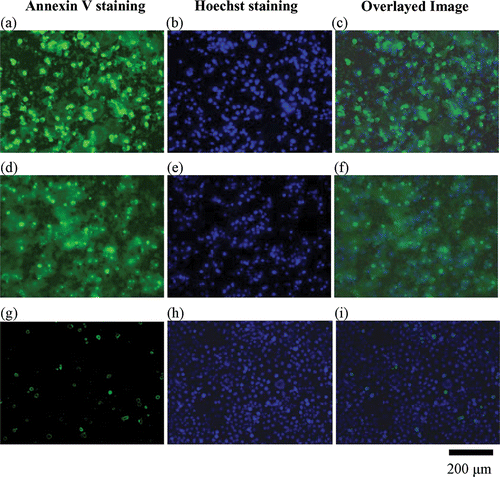
Figure 4. Images of fluorescent staining of Annexin V, Hoechst and overlay in Chago-K1 cells following 24 h treatment of different TiO2 concentrations. Cell nuclei were stained light blue by Hoechst dye in the untreated control group but appeared rounded and brightly fluorescent in the treated groups. The green Annexin V staining clearly labelled cell membrane confirming translocation of phosphatidylserine from the inner to outer leaflet of cell membrane. (a)–(c) Treatment of 1 mg mL−1 TiO2 in Chago-K1 cells. (d)–(e) Treatment of 0.3 mg mL−1 TiO2 also revealed significant increase in Annexin V and Hoechst staining compared to the control (no nanoparticles) (g)–(i).

Reprints and Corporate Permissions

Please note: Selecting permissions does not provide access to the full text of the article, please see our help page How do I view content?

To request a reprint or corporate permissions for this article, please click on the relevant link below:

Academic Permissions

Please note: Selecting permissions does not provide access to the full text of the article, please see our help page How do I view content?

Obtain permissions instantly via Rightslink by clicking on the button below:

If you are unable to obtain permissions via Rightslink, please complete and submit this Permissions form. For more information, please visit our Permissions help page.