Figures & data
Table 1. Performance of Japanese quails fed diets containing varying levels of sorghum grain inclusions and nutrients digestibility of the diets.
Table 1. Bird performance from d0 to 35 and AME, N retention, AMEn and gizzard weights of birds at d35 fed diets with graded inclusion of oat husks.
Table 1. The effect of feed efficiency on body weights and performance of layer hens.
Table 1. Interaction effects of two different light bulbs and distance on growth and behaviour of broiler birds.
Figure 1. Mucin adherent layer thickness of birds fed different levels of semi synthetic ingredients.
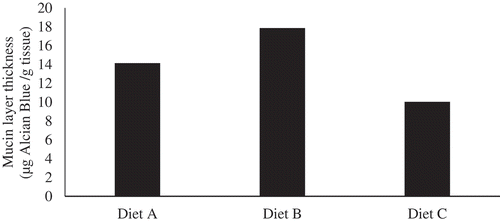
Table 1. Fold change (mean ± S.E.) of mRNA expression of IFN-γ, IL-10 and IL-6 in the ileum tissue at day 7, 21 and 42.
Table 1. Effect of naked neck gene and housing system on productive traits and immune response of laying hens
Table 1. Effect of different levels of turmeric rhizome powder on performance and physiological response of broiler chickens.
Table 1. The effect of experimental treatment on broiler performance, drip loss and thaw loss.
Table 1. Effect of wheat variety, growing site and xylanase supplementation on broiler AME (MJ/kg DM).
Table 1. The effect of cultivar, processing and protease on AME, AMEn and NR (DM basis) of RSM supplemented diets.
Table 1. Environmental impacts of broilers fed a 16% CP diet relative to a 19% CP diet at both feed mill and farm gate (%).
Table 1. Growth performance and pre-caecal flow of selected soluble carbohydrate fractions (g/100g ileal digesta) in response to supplementation of xylanase or prebiotic xylose oligosaccharide.
Table 1. Genetic characteristics.
Table 1. Effects of different sources of Zn on performance, egg quality and retention in laying hens.
Table 1. Effects of different sources of Zn on performance in laying hens.
Table 1. Quantitative PCR data for FeHyD gene indicating efficacy of the AMPs against Histomonas meleagridis following 24 h of exposure. RFU: relative fluorescence units.
Table 1. Effect of fenugreek and garden cress dietary supplementation on growth performance and immune response of broilers.
Table 1. Coefficient of amino acid digestibility of two wheat cultivars, at four geographical locations, for broiler chickens.
Table 1. Cumulative performance data for day 0–21 of Si trial and plasma Si content on d21 (S.E.).
Table 2. Bioavailable Si in ileal and jejunal digesta on d21 of trial (S.E.).
Table 1. Tibia measures and body weight in birds fed diets with and without silica.
Table 2. Comparison of growth plates in birds fed diets with and without silica.
Table 1. The effects of supplementary Se sources on broilers feed intake (FI), weight gain (WG), feed conversion ratio (FCR), Se in liver and breast, and glutathione peroxidase (GSH-Px) in blood.

