
Figures & data
Table 1. Bodyweight gain (BWG), feed intake (FI), feed conversion ratio (FCR) and breast meat yield in broilers fed standard and acidified wheat to day 35. a-b Means within the same column with no common superscript differ significantly (P < 0.05)
Figure 1. Jejunal enterococcus abundance Vs body weight gain at day 28 (T2).
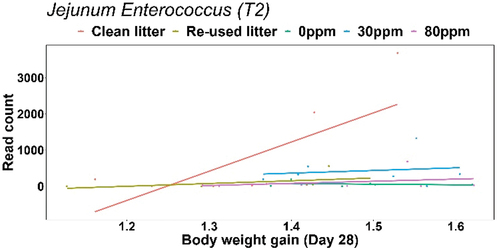
Table 1. Impact of diet and age on bone strength, BWG, FCR & FI of broilers at varying time points
Table 1. The effect of XOS source and dose on SCFA caecal production (mmol/kg)
Table 1. a) Growth performance, b) intestinal lesions and Eimeria shedding in faeces at d 28 during coccidiosis challenge
Table 1. Estimation of the standardised ileal digestible (SID) calcium requirement of broilers fed standard or high phytate diets
Table 1. The relationship between broiler litter and hen manure DM and gaseous emissions
Table 1. Effects of phytase on cumulative growth performance and on total feed cost per kilogram of bodyweight gain (1–32 days)
Table 2. Effects of phytase on tibia ash content (% DM) and ash weight on 10 and 32 d of age
Table 1. Cumulative performance results (0–42 days)
Table 1. Effect of low protein diets with oat hulls differing in particle size on ileal amino acid digestibility on day 24
Table 1. Effect of standard and low protein diets with maize increasing in particle size on growth performance, nitrogen efficiency (D0-21) and litter characteristics (D20)
Table 1. Body weight (BW), feed conversion ratio (FCR) and caecal phyla relative abundance and its ratio
Table 1. Effect of Rovabio PhyPlus on growth performance, tibia ash and P (phosphorous) contents, and P digestibility in broilers
Figure 1. Mean fitted bone strength of UK laying hens (solid line) and 95% confidence intervals (shaded area) over age (weeks) modelled with a Gaussian LMM, with farm and individual bird fitted as random terms in the model. Data is split by housing system and bone type.
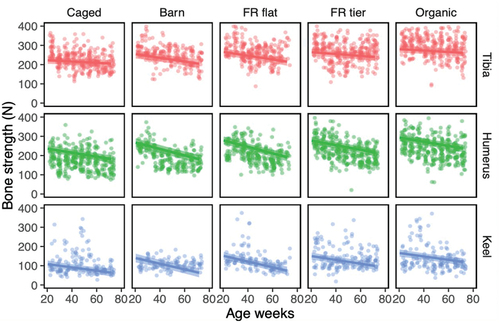
Table 1. Mean clinical scores (range: 0–3) and respiratory rate (counts/min) in hens subjected to a live vaccine, which were significantly affected by day (all P < 0.001). Mean values are from raw data, with standard deviation (SD) range shown
Figure 1. Mean scores (n=20 hens) of abnormal breathing, scored on a scale of 0-3, with standard deviation shown. Arrows show the day saline control and vaccination via ocular and nasal drop occurred.
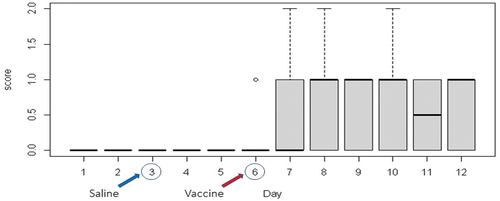
Table 1. Effect of dietary black pepper (BP) and xylanase (XYL) on blood serum chemical composition
Table 1. The effect of added fibres and xylanase and their interaction on performance and AMEn