Figures & data
Table 1. Clinical characteristics of patients in the development and validation cohorts.
Table 2. Univariate logistic regression for prediction of the occurrence of ASUC within 1 year in development and validation cohorts.
Table 3. Univariate and multivariate logistic regression model for prediction of the occurrence of ASUC within 1 year.
Figure 1. Receiver operating characteristic (ROC) curves of five predictors were plotted to predict the occurrence of ASUC within 1 year. The red line represents the development cohort, while the green line represents the validation cohort. The area under the ROC curve in the training cohort was determined to be 0.982 (95% CI, 0.964–1.000). Similarly, in the validation group, it was found to be 0.925 (95% CI, 0.865–0.984).
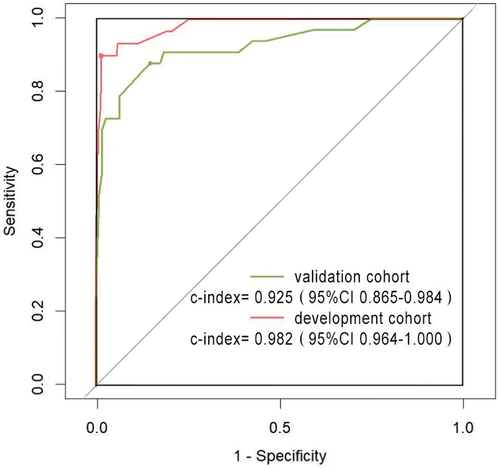
Figure 2. Calibration curves were generated for the training model in the development cohort (a) and validation cohort (b). The x-axis denotes predicted ASUC risk, while the y-axis represents actual ASUC rate. The green line indicates model performance, with 45-degree dotted lines representing perfect prediction. A closer fit between the green line and dotted line signifies greater accuracy of the model.
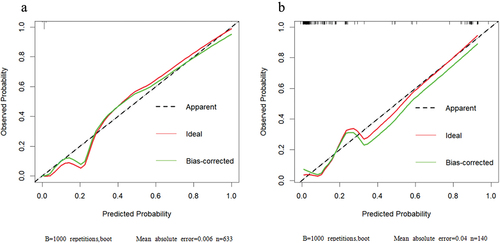
Figure 3. Nomogram constructed using coefficients derived from multivariate analysis as weights to predict the risk of developing ASUC within one year of diagnosis in a given patient. To calculate the probability of ASUC, each predictor’s value was obtained by drawing a vertical line straight upward from that factor to the point axis. The points achieved for each predictor were then summed and located on the total point axis of the nomogram. By drawing a vertical line downward, one could locate the probability of ASUC.