
Figures & data
Table 1. Sample characteristics.
Figure 1. Images of the three tricycle categories. High seat = >70 cm, medium seat = 57–63 cm and low seat = <57 cm.
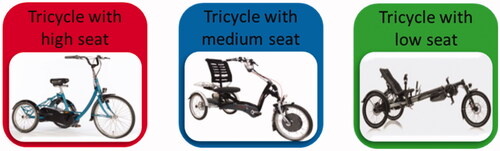
Figure 2. Type of tricycle related to age in years. The thick, vertical, yellow lines represent the medians and the thin yellow lines represent a 95% CI.
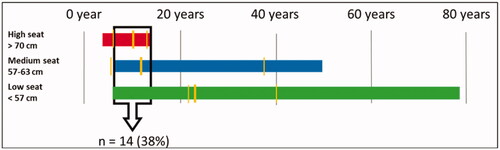
Figure 3. Type of tricycle related to scores on the 6-min walk test in metres (m). The thick, vertical, yellow lines represent the medians and the thin yellow lines indicate a 95% CI.
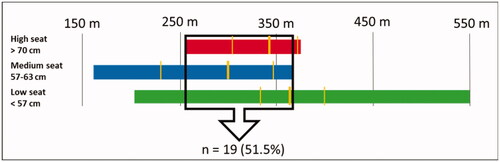
Figure 4. Choice of tricycle based on sex.
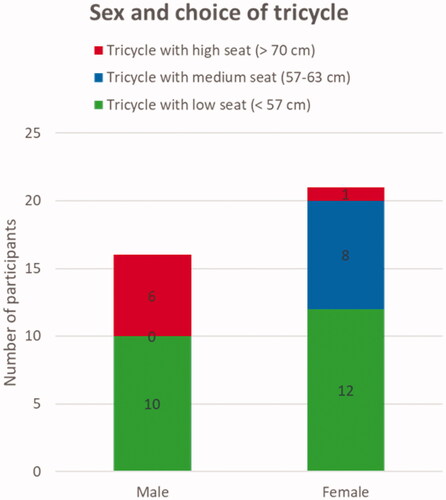
Figure 5. Type of tricycle related to scores (repetitions) on the 30-s sit-to-stand test. The thick, vertical, yellow lines represent the medians and the thin yellow lines indicate the 95% CI.
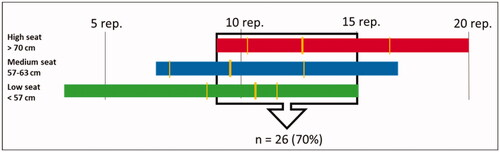
Figure 6. Type of tricycle related to scores on the Trunk Impairment Scale (0–16 points). The thick, vertical, yellow lines represent the medians and the thin yellow lines indicate a 95% CI.
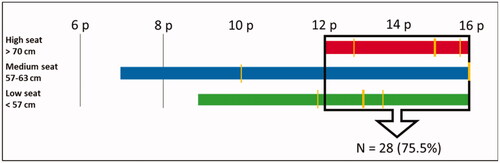
Figure 7. Type of tricycle related to muscle strength as measured with the Oxford Grading Scale for manual muscle testing. Reduced = 0–4 of 5, normal = 5 of 5.
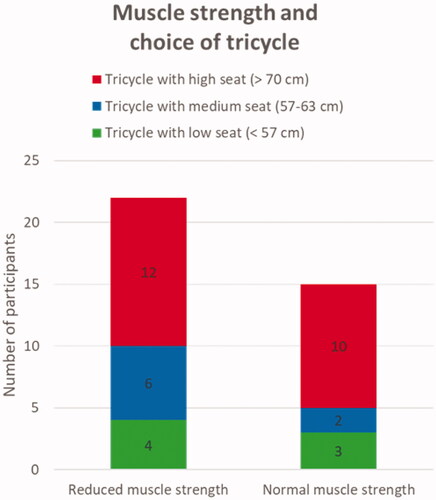
Figure 8. Type of tricycle related to the range of motion (ROM) in legs and arms as measured with a goniometer. Reduced ROM = reduced in at least one joint.
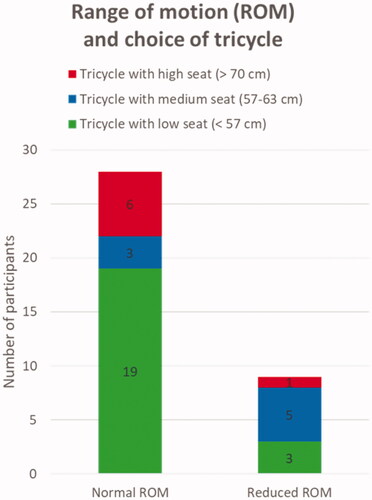
Table 2. Participants’ reasons for choice of tricycle (n = 17).