
Figures & data
Figure 1. CONSORT 2010 Flow diagram.
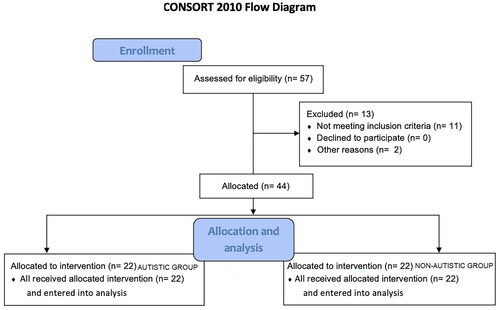
Figure 2. Participant Positioning and game design. The task was to intercept different falling spheres using upper limb wave movements at the exact moment the spheres reached their specific target. Bottom right image, miss feedback - above this one, hit feedback. The game is available for free use in Portuguese https://movehero.com.br/ and English https://movehero.com.br/en/.
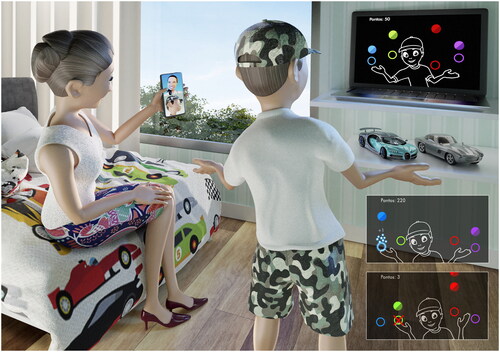
Figure 3. Study design.
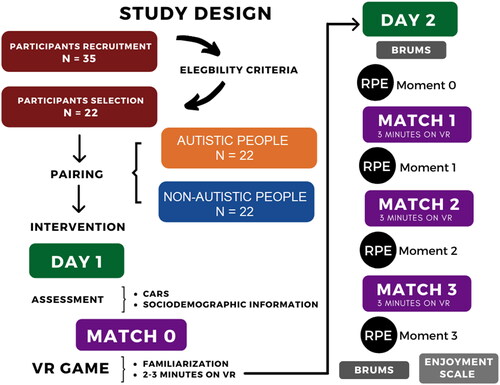
Table 1. Participant’s characteristics.
Figure 4. Absolute error and variable error mean and standard error for both ASD and non-ASD groups.
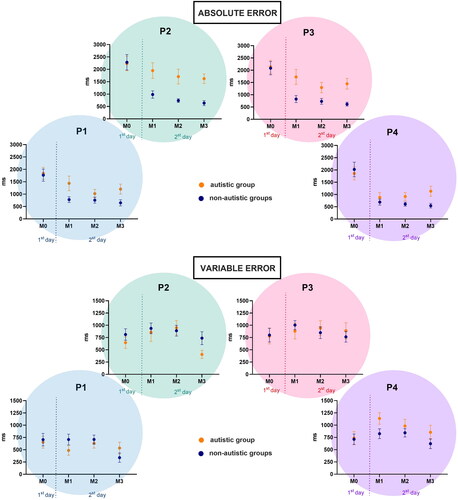
Figure 5. Mean and standard error of percentage of hits, misses and the continuous score, for both ASD and non-ASD groups.
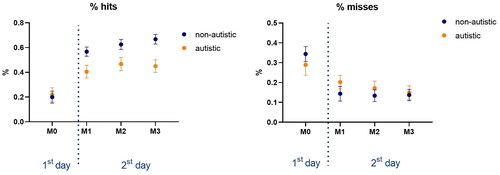
Figure 6. Mean and standard error of RPE score (a) and representation of the answers of the individuals regarding their enjoyment with the game (b) for both ASD and non-ASD groups.
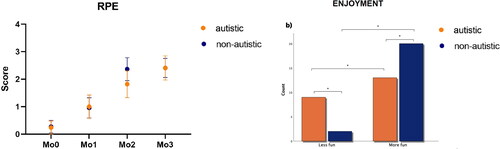
Table 2. Brunel Mood Scale (BRUMS) for both groups, before and after the intervention.