Figures & data
Figure 1. a: Effect of reaction temperature; b: reaction time and amount of anticoyclic acid; c: on fluorescence intensity of L-AgNPs.
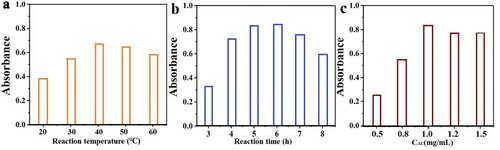
Figure 2. a: UV-Vis spectra of L-AgNPs; b: N2 adsorption-desorption isotherms of L-AgNPs.
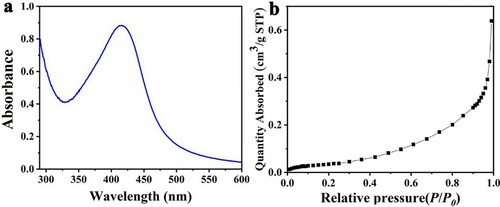
Figure 3. TEM of L-AgNPs.
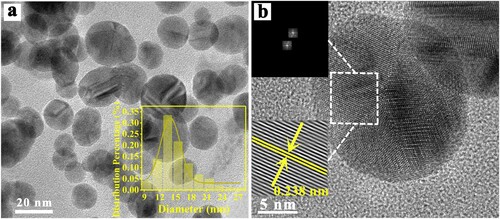
Figure 4. a: X-ray diffraction patterns of L-AgNPs; b: Full spectrum fitting of XRD.
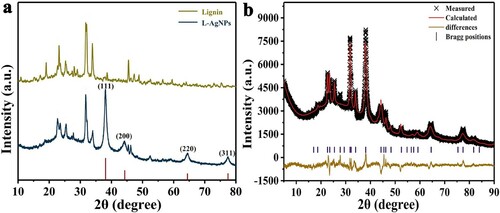
Figure 5. a: XPS full spectrum of L-AgNPs; b: XPS spectrum of C1s; c: XPS spectrum of O1s; d: XPS spectrum of Ag3d.
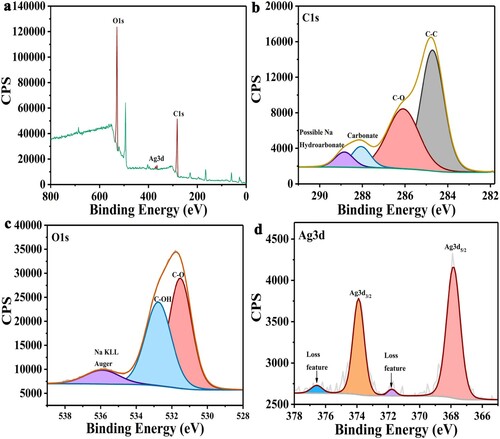
Figure 6. a: Inhibition circles of L-AgNPs against E.coli; b: Inhibition circles of L-AgNPs against C. albicans.
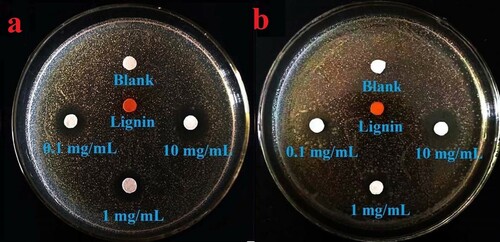
Figure 7. The growth curve added after L-AgNPs. a: E.coli.; b: C. albicans.
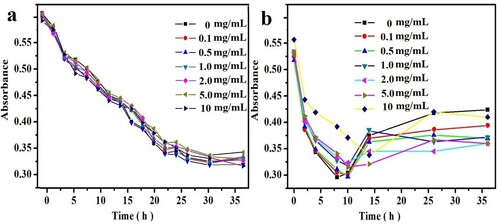
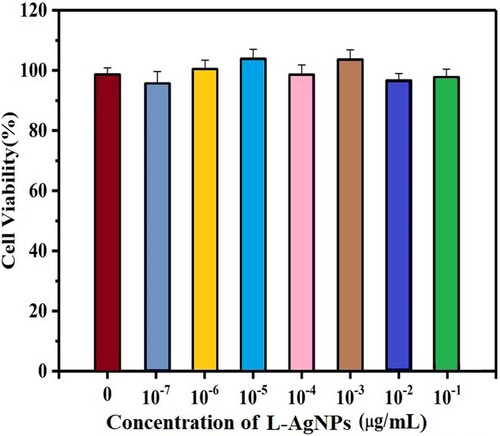
Figure 8. After being incubated L-AgNPs in the concentrations, the viability of A549 cells range from 0 to 10−7 μg/mL. The error bars show standard deviations on the basis of three independent measurements.