Figures & data
Table 1. Procedures of the high intensity interval training program
Figure 1. Flowchart of participants.
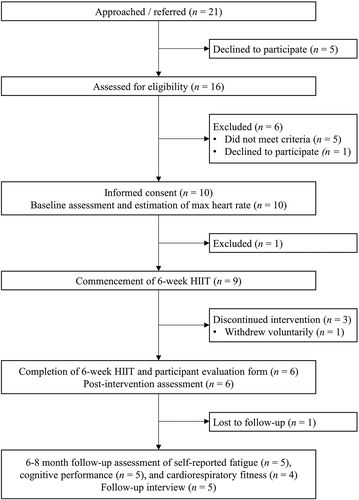
Table 2. Baseline characteristics
Table 3. Minutes of weekly physical activity and exercise in the study period
Figure 2. Indicators of feasibility and adherence during high intensity interval training.
Note. Part B, C, and D shows data recorded at high intensity intervals only. Boxes extend to the first and third quartiles, and the horizontal line corresponds to the median. Whiskers extend to the largest and smallest value within 1.5 times the inter-quartile range. Dots correspond to values beyond the range of the whiskers (outliers). Regarding part B and D, max heart rate and max watt, respectively, were determined at the baseline watt-max test.
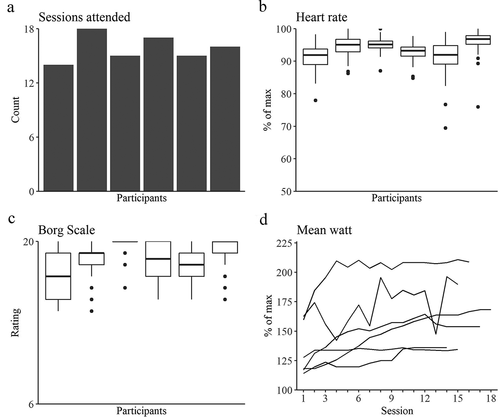
Table 4. Changes in study outcomes of six individuals with acquired brain injury receiving high intensity interval training
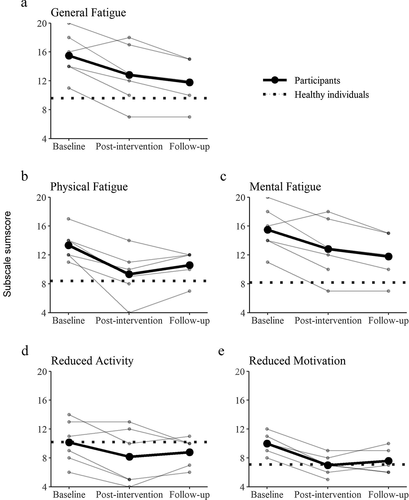
Figure 3. Raw and mean scores on the multidimensional fatigue inventory.
Note. Straight lines indicate raw (transparent) and mean (bold) scores of participants on subscales of the Multidimensional Fatigue Inventory at i) baseline, ii) completion of High Intensity Interval Training (HIIT), and iii) 6–8 months after completion of HIIT. Dashed lines indicate mean scores of healthy individuals (N = 168, age range = 15–30 years), provided by Norup et al.Citation13 One participant was lost to follow-up.