
Figures & data
Figure 1. Participant characteristics. GMFCS = Gross Motor Function Classification System; CFCS = Communication Function Classification System.
Table 1. Statistics on composite scores.
Table 2. Diagnostic agreement in fatigue classification between the General Fatigue subscale of the Multidimensional Fatigue Inventory and the Modified Mental Fatigue Scale.
Figure 2. Individual rank comparisons across scales. Higher rank corresponds to higher score. FISSA Impact = Impact Scale of the Fatigue Impact and Severity Self-Assessment; m-MFS = Modified Mental Fatigue Scale; MFI-20 = Multidimensional Fatigue Inventory. Participants are color graded according to their FISSA rank as a reference.
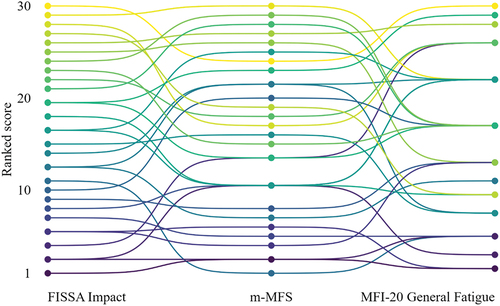
Table 3. Correlations among fatigue scales.
Figure 3. Associations between fatigue vs. gender, age, and motor function. FISSA Impact = Impact Scale of the Fatigue Impact and Severity Self-Assessment; m-MFS = Modified Mental Fatigue Scale; MFI-20 GF = General Fatigue subscale of the Multidimensional Fatigue Inventory; GMFCS = General Motor Function Classification System. Highest and lowest possible scale score in brackets. Boxes extend to the first and third quartile, and the center line corresponds to the median. Whiskers extend to the largest and smallest value within 1.5 times the interquartile range. Dots represent individual values. Solid lines represent locally estimated scatterplot smoothing.
Supplemental Material
Download MS Word (592.2 KB)Data availability statement
The data for this paper cannot be made publicly available due to GDPR regulations as the combined background data at an individual level is considered personally attributable.