Figures & data
Figure 1. Case study area of the research.
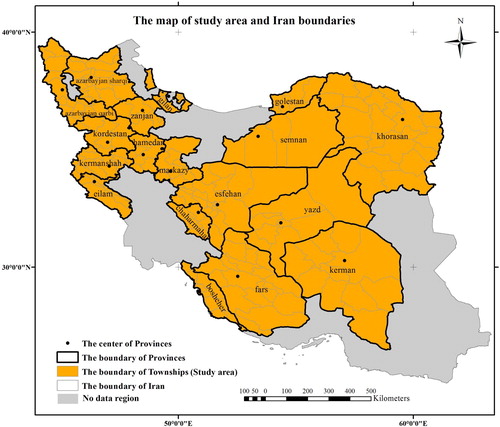
Table 1. Causative factors of skin cancer and their spatial units.
Table 2. The considered time interval for causative factors in the model.
Figure 2. The maps of 11-yrars average of temperature, pressure, brightness sun shine hours, and humidity parameters.
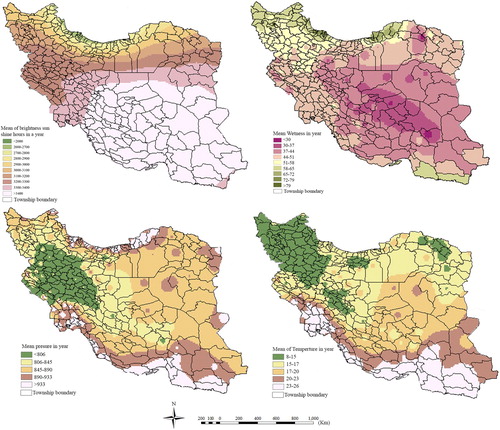
Figure 3. Long-term records of surface UV data produced by ‘Longterm Multi-Sensoral UV Record’ project.
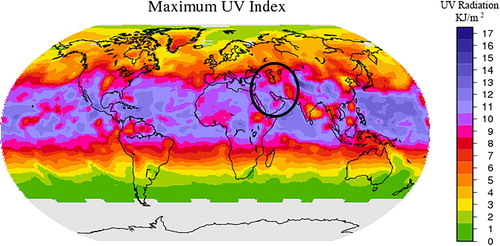
Figure 4. The modelling process flow diagram.
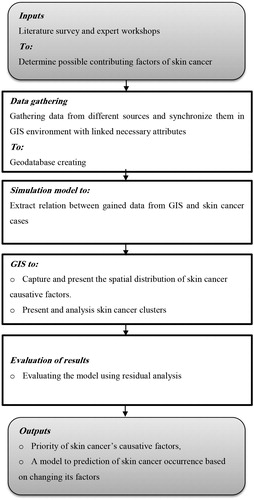
Figure 5. Chart of the distribution function of skin cancer data.
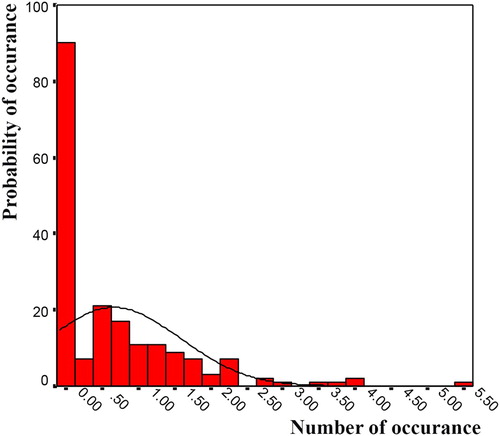
Table 3. Comparison between deviance residual of parameter selection methods.
Figure 6. Chart showing the deviance residuals of the 3 regression methods (6.1. stepwise method, 6.2. backward elimination method, and 6.3. forward selection method).
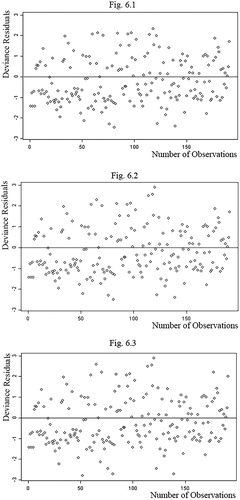
Figure 7. Map of the residuals in the stepwise approach.
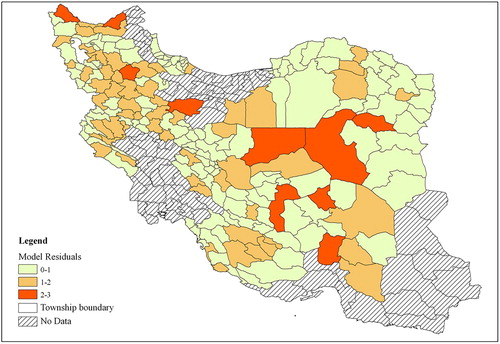
Table 4. Variables that emerged in the model along with their positive/negative sign in the model.
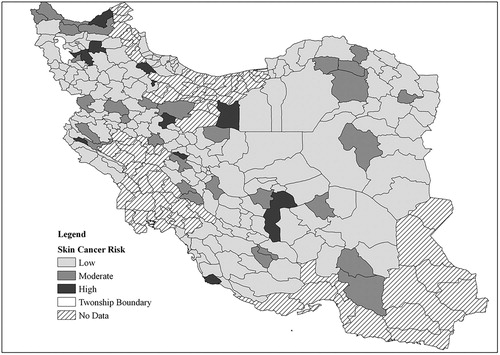
Figure 8. The probability mapping of skin cancer occurrences calculated from the model.
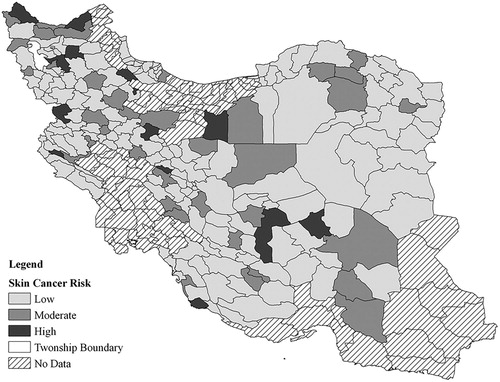
Figure 9. The probability mapping of skin cancer occurrences calculated from the model, with the consumption of fruits and vegetables increased by 20%.